Case study · Hospitality · AI platform

Thousands of reviews, turned into clear decisions.

nrtureAI reads every guest review, shows what moves spend, and replies in the brand's voice. I led design for the website and the dashboard.
Client
tRetail Labs
Industry
Hospitality · AI review intelligence
Product
Marketing website and analytics dashboard
Timeframe
2025 · Ongoing
My role
Lead designer: UX research, wireframing, visual design, design system, prototyping
Tools
Figma, FigJam
Links
Visit nrture.ai
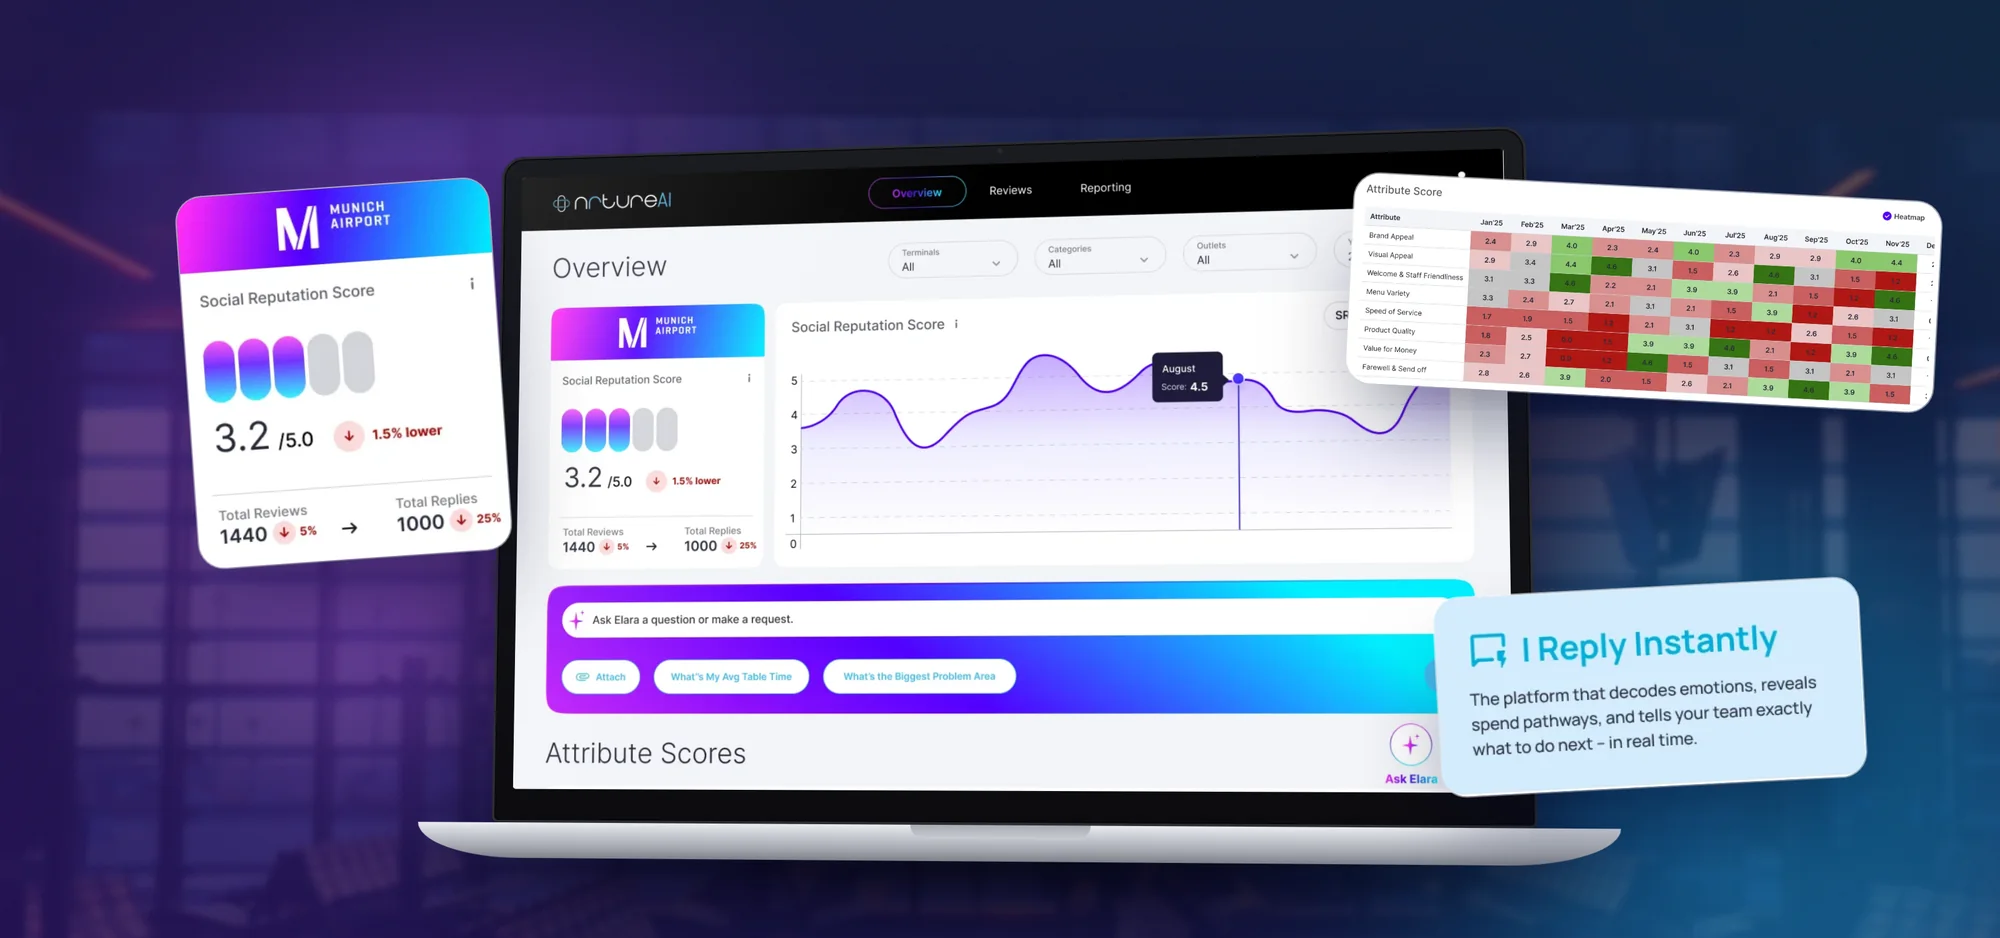
nrtureAI website and dashboard

01 · The short version

The project in a minute

The problem

A new category to explain

Most review tools stop at positive or negative. nrtureAI goes much further, and the design had to make that clear fast.

What I did

Two surfaces, one system

Structured a website that sells a new idea, and a dashboard that turns complex review data into answers.

The result

From reviews to actions

Operators see one score, ask Elara questions in plain words, and spot where the experience slips.

2surfaces: website and dashboard
8+experience attributes charted over time
5venue types, from hotels to airports
2very different clients on one system

02 · Who it's for

Built for people who run venues

Restaurant, hotel and airport managers don't have time to read every review. They need to know what to fix, and where.

Primary users

Restaurants · Hotels · Airport F&B · Attractions · Multi‑venue operators

“Tell me what guests really think, and what I should do about it today.”The brief in one line, as I framed it

  1. Explain it fastThe value is clear in the first scroll.
  2. AI that feels humanElara is warm and on‑brand, not a bot.
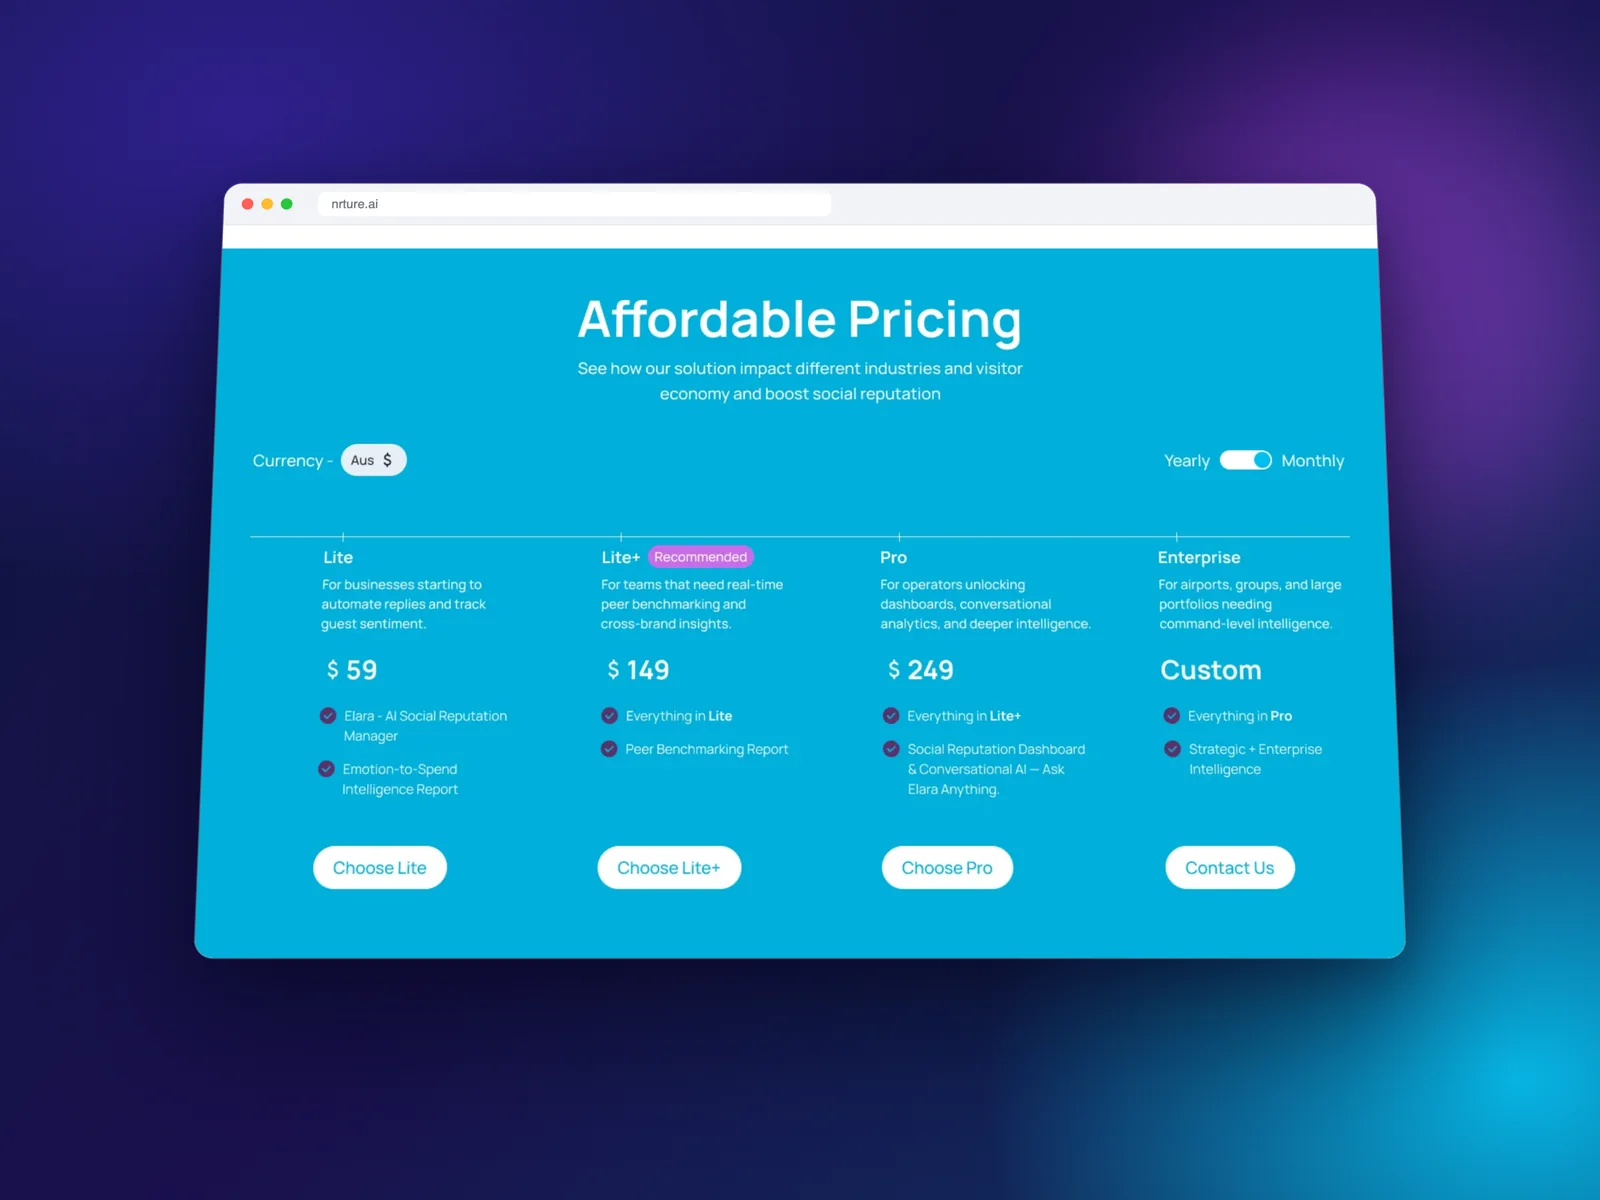
  3. Earn trust earlyStats, logos, testimonials and clear pricing.
  4. Tame complex data8+ attributes, peers and venues, read at a glance.
  5. Scale across venuesOne system for an airport food court or a wine region.

03 · How it came together

Research, structure, design

A new category needs the story worked out before the pixels.

  1. 1

    Step 1

    Research

    Studied how leading SaaS and AI products tell their story, and listed open questions for the team.

    • Research
    • FigJam
  2. 2

    Step 2

    Structure

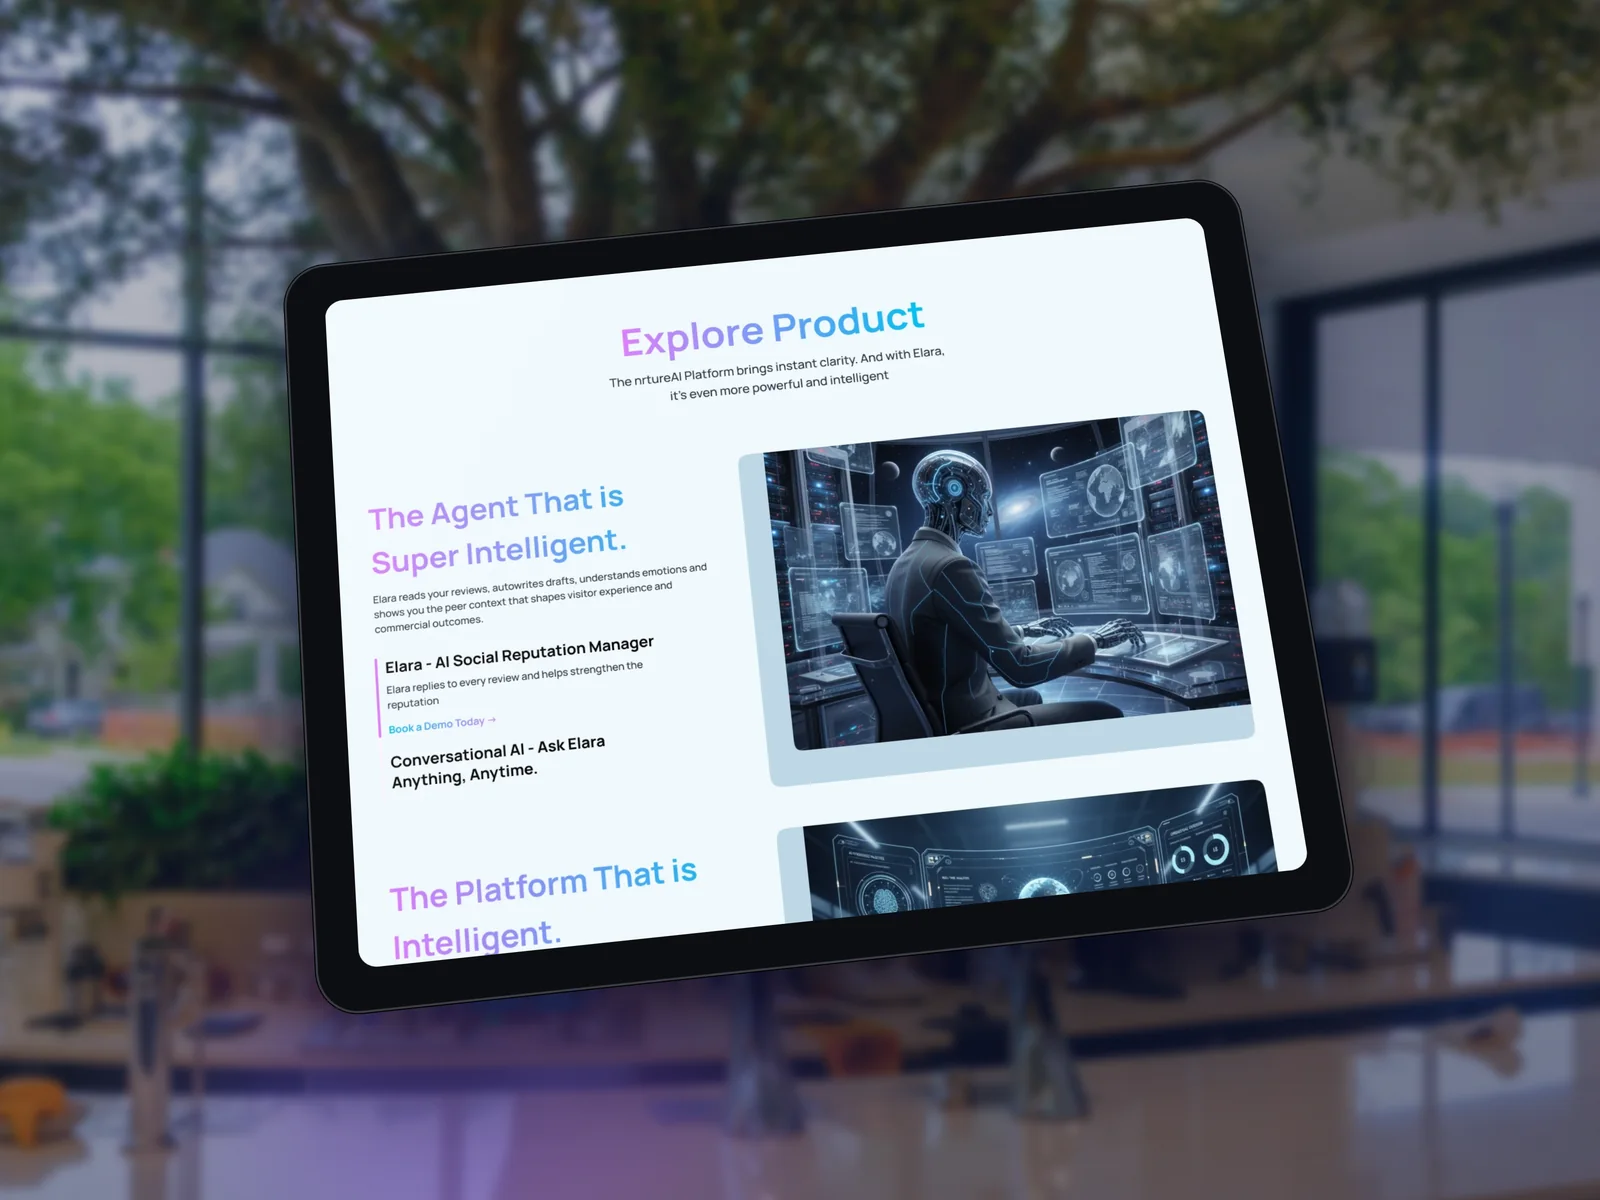
    The website flow: hero, the problem, meet Elara, product, then proof and pricing.

    • IA
    • Wireframes
  3. 3

    Step 3

    Design & review

    Visual language, the dashboard, and written design reviews after every round.
    • Visual design
    • Design system
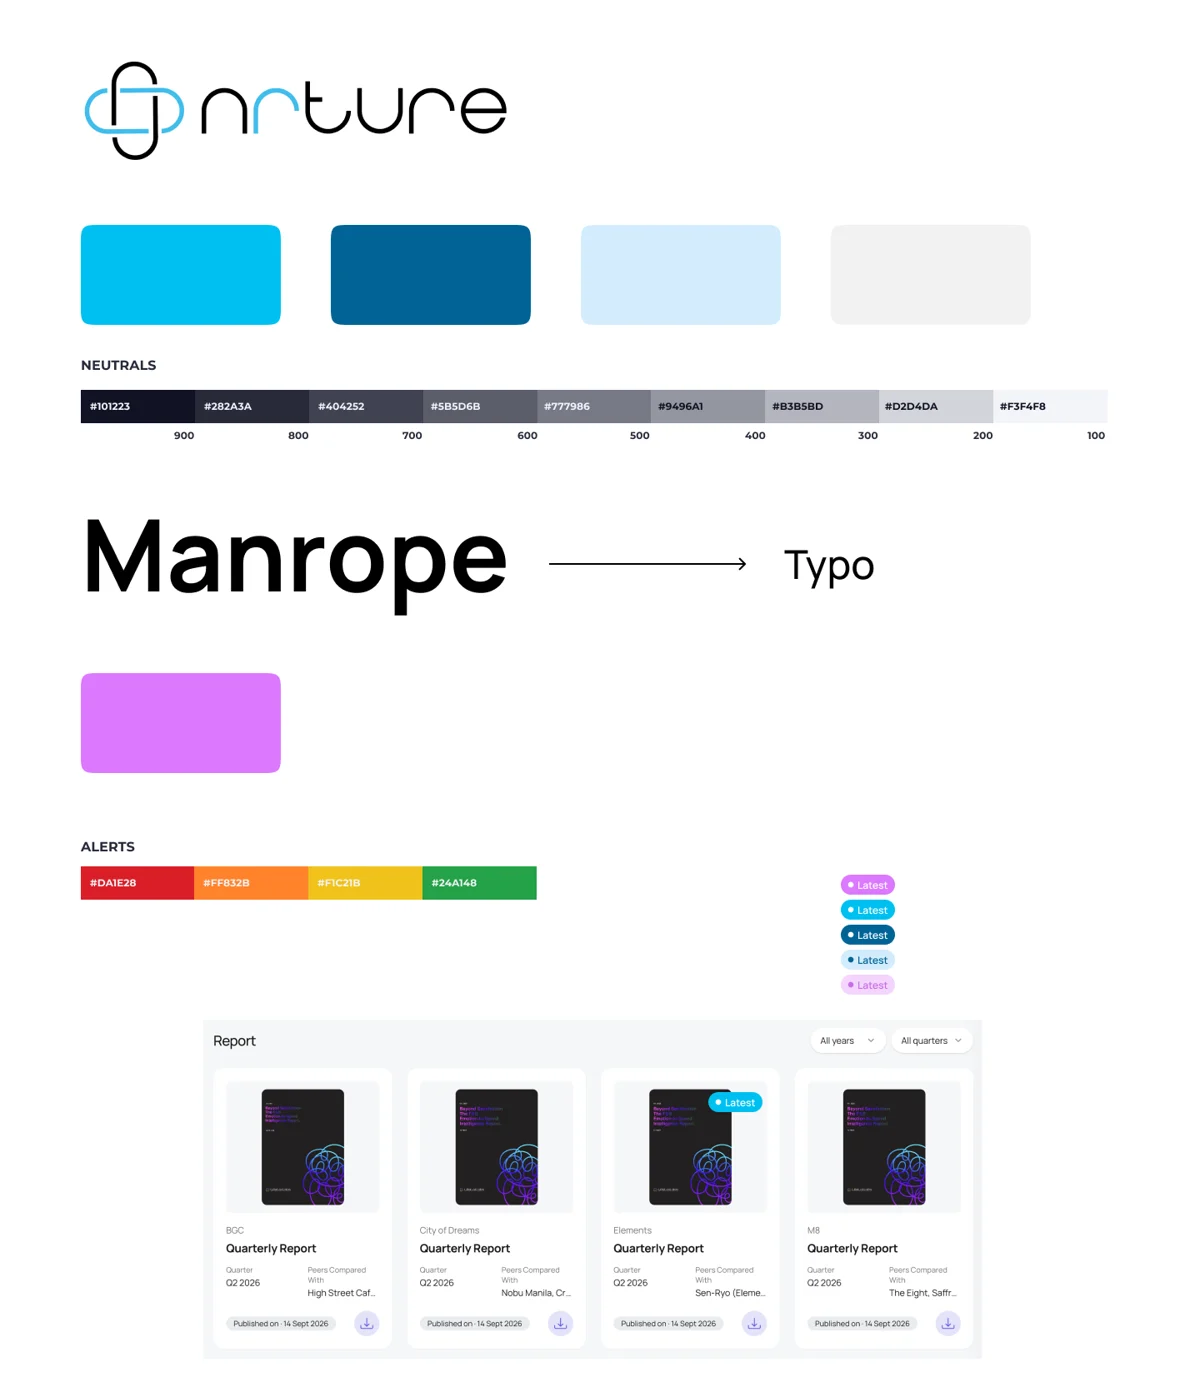
nrtureAI style guide
The visual language: cyan for energy, deep blue for trust, and violet for anything Elara touches. Manrope for type.

04 · Key decisions

The choices that made it work

Decision 01

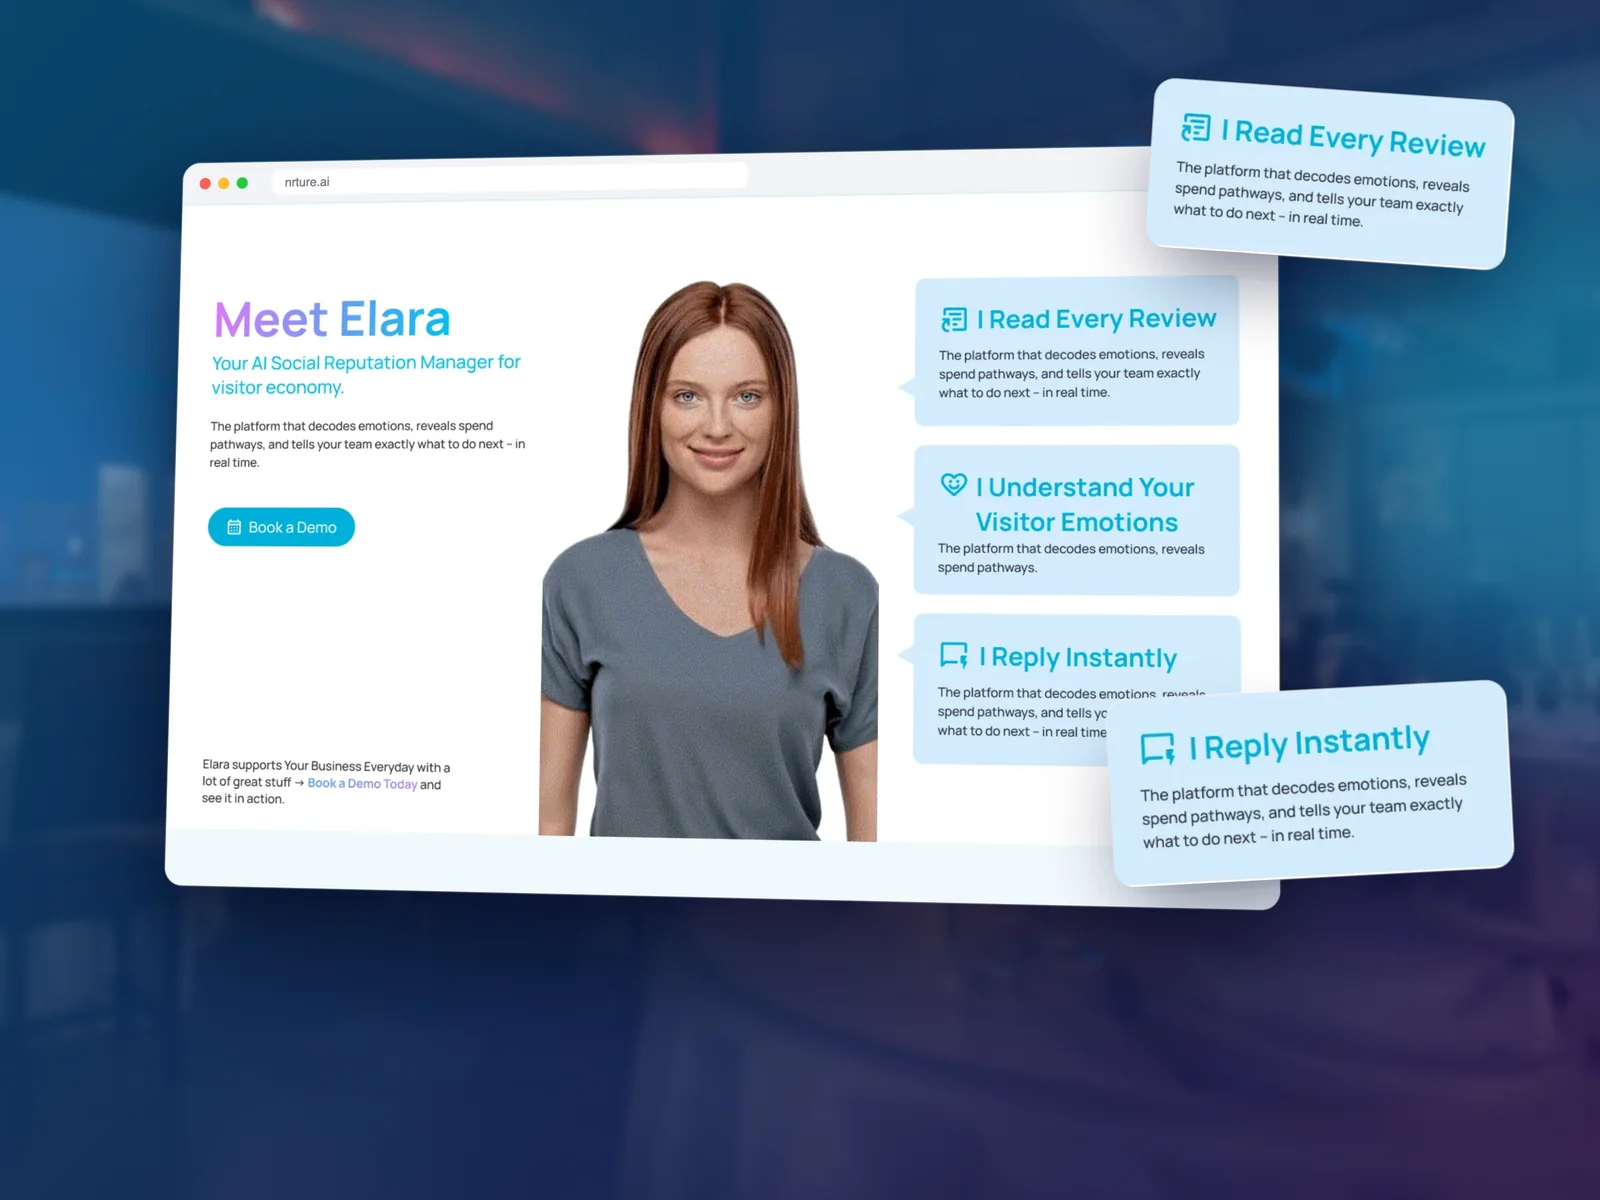
Introduce the AI as a person

Why
Generic AI feels cold. Operators need to trust who's replying to their guests.
What I did
Elara is shown as a person with three simple promises: she reads every review, understands emotions and replies instantly.
Meet Elara section

Decision 02

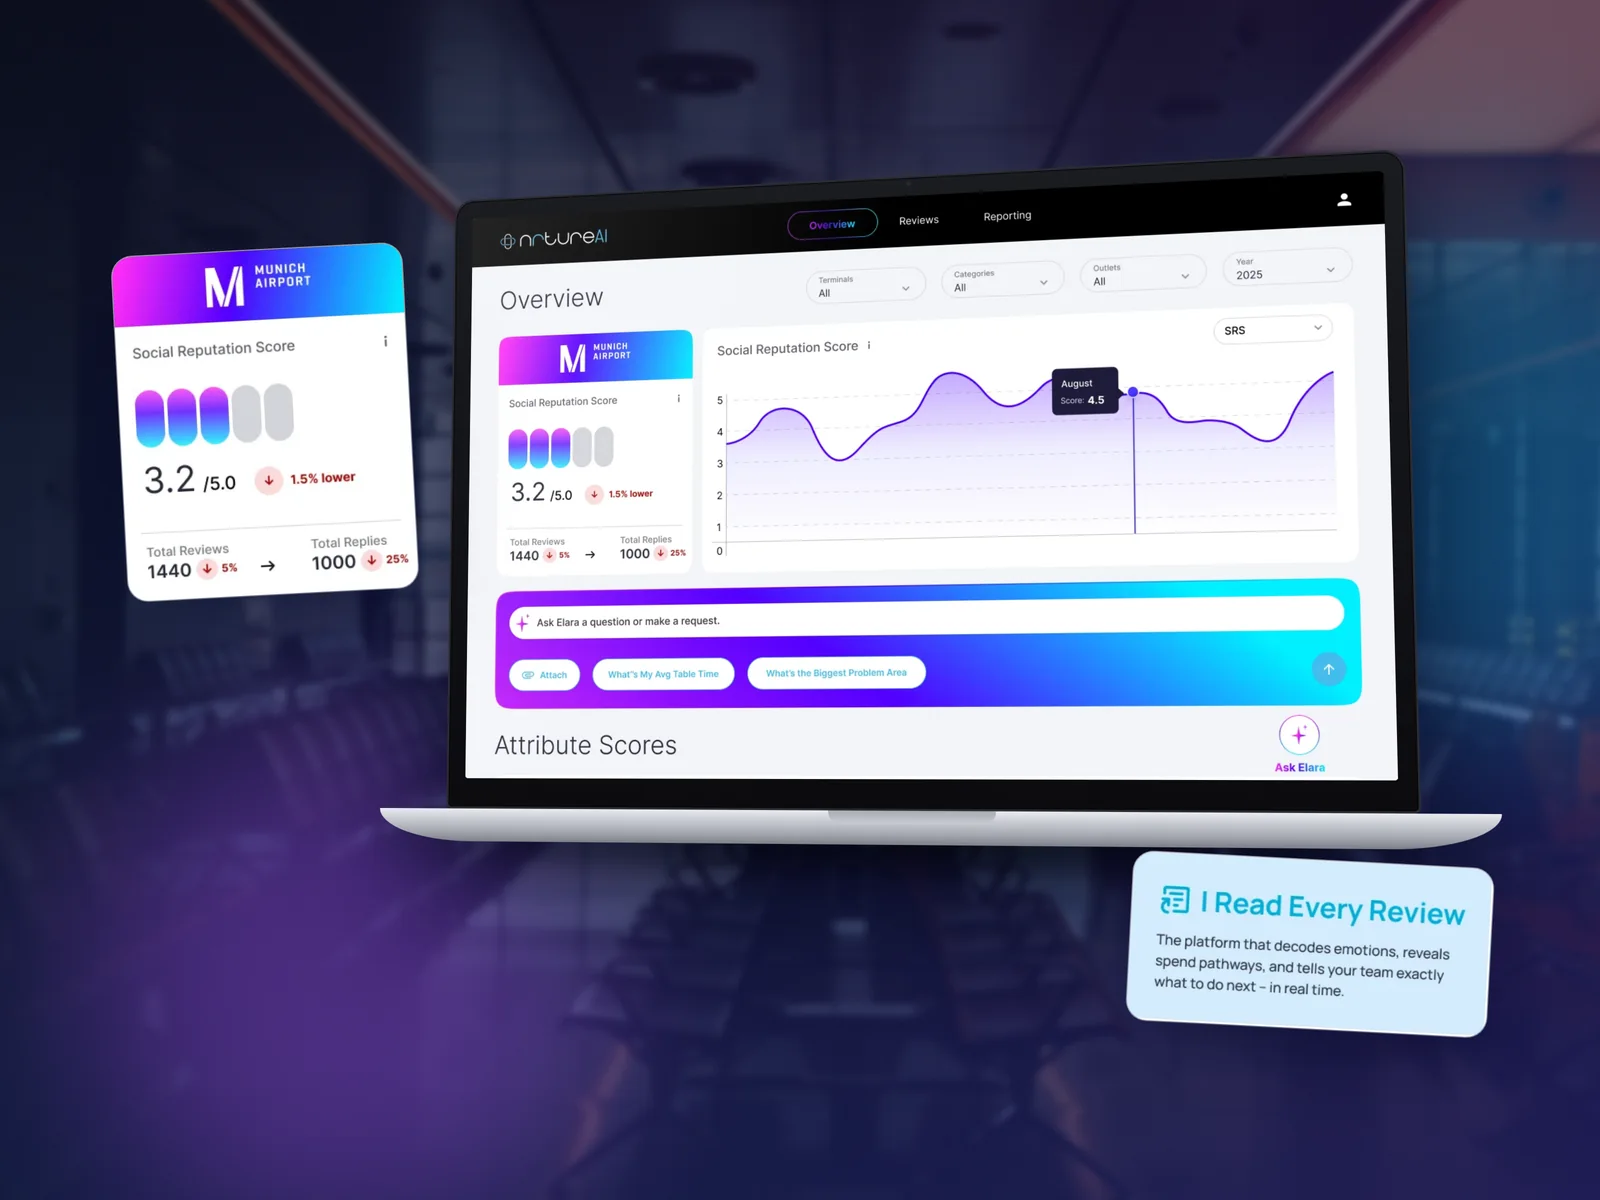
Ask, don't filter

Why
Managers want answers, not a maze of filters and tabs.
What I did
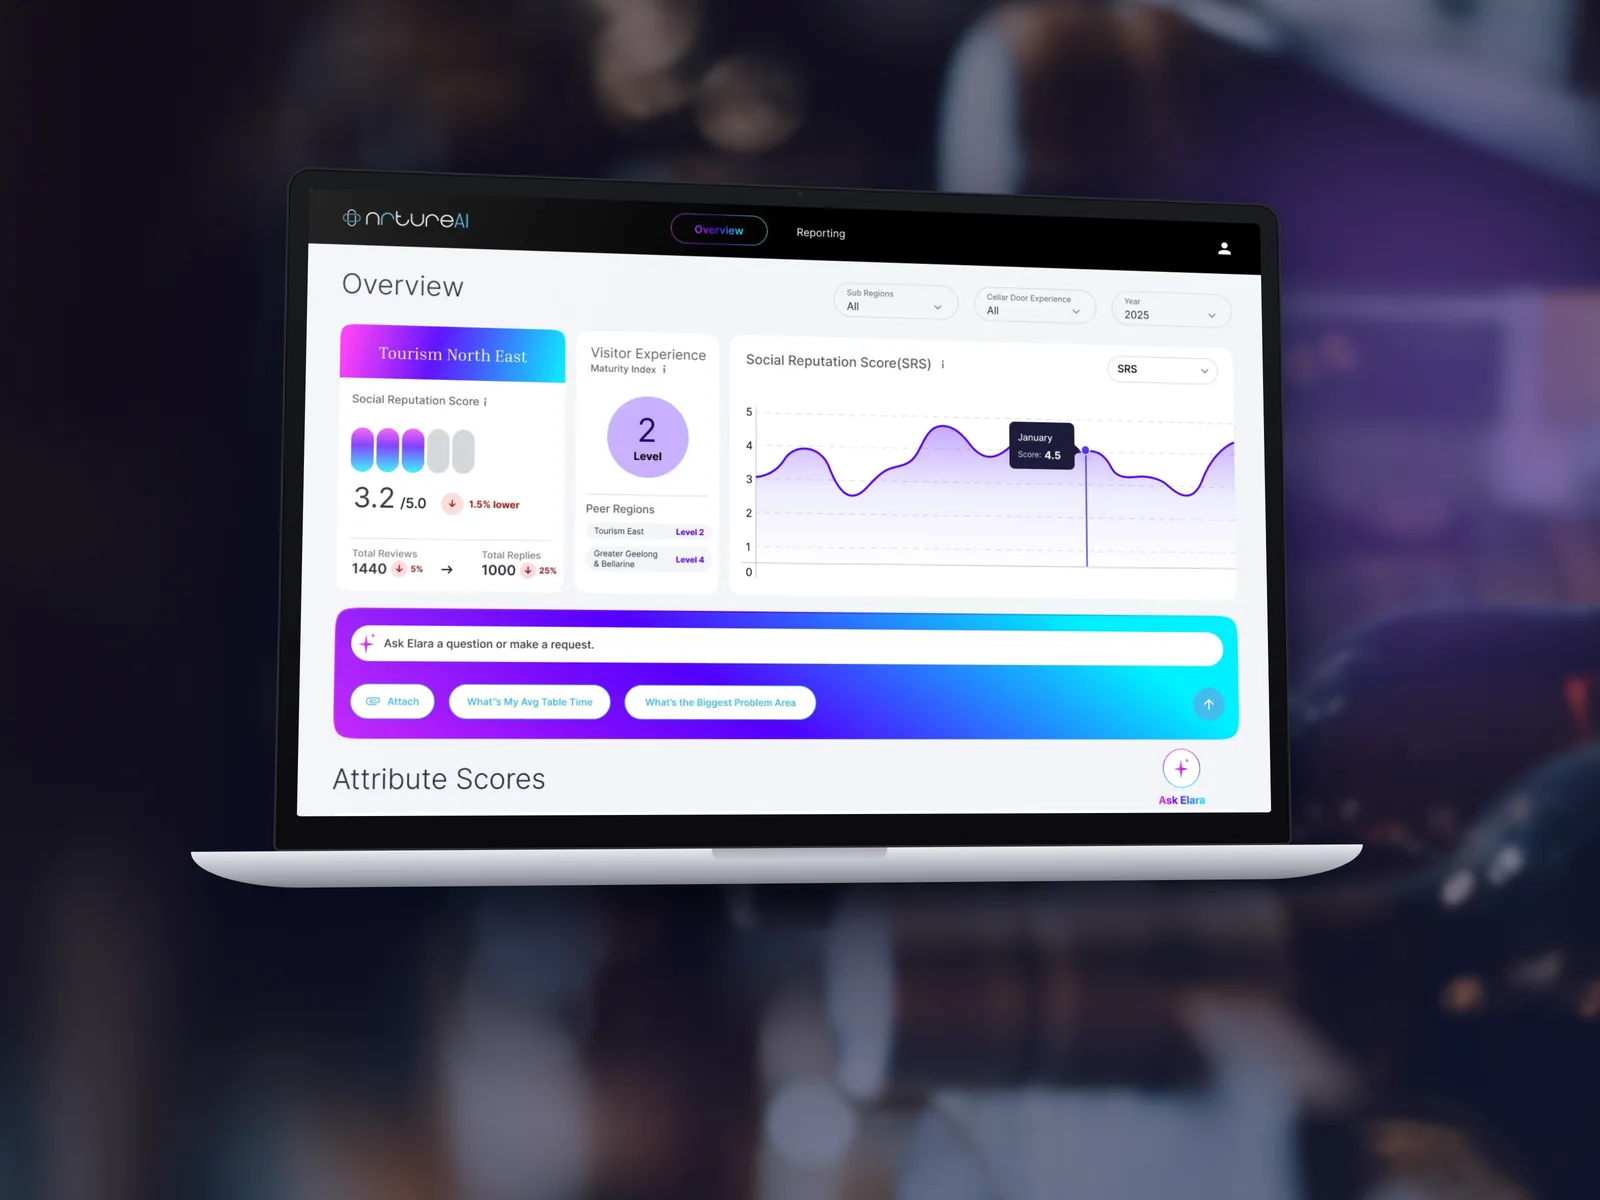
An “Ask Elara” bar with suggested questions sits right under the headline score.
Dashboard overview with Ask Elara

Decision 03

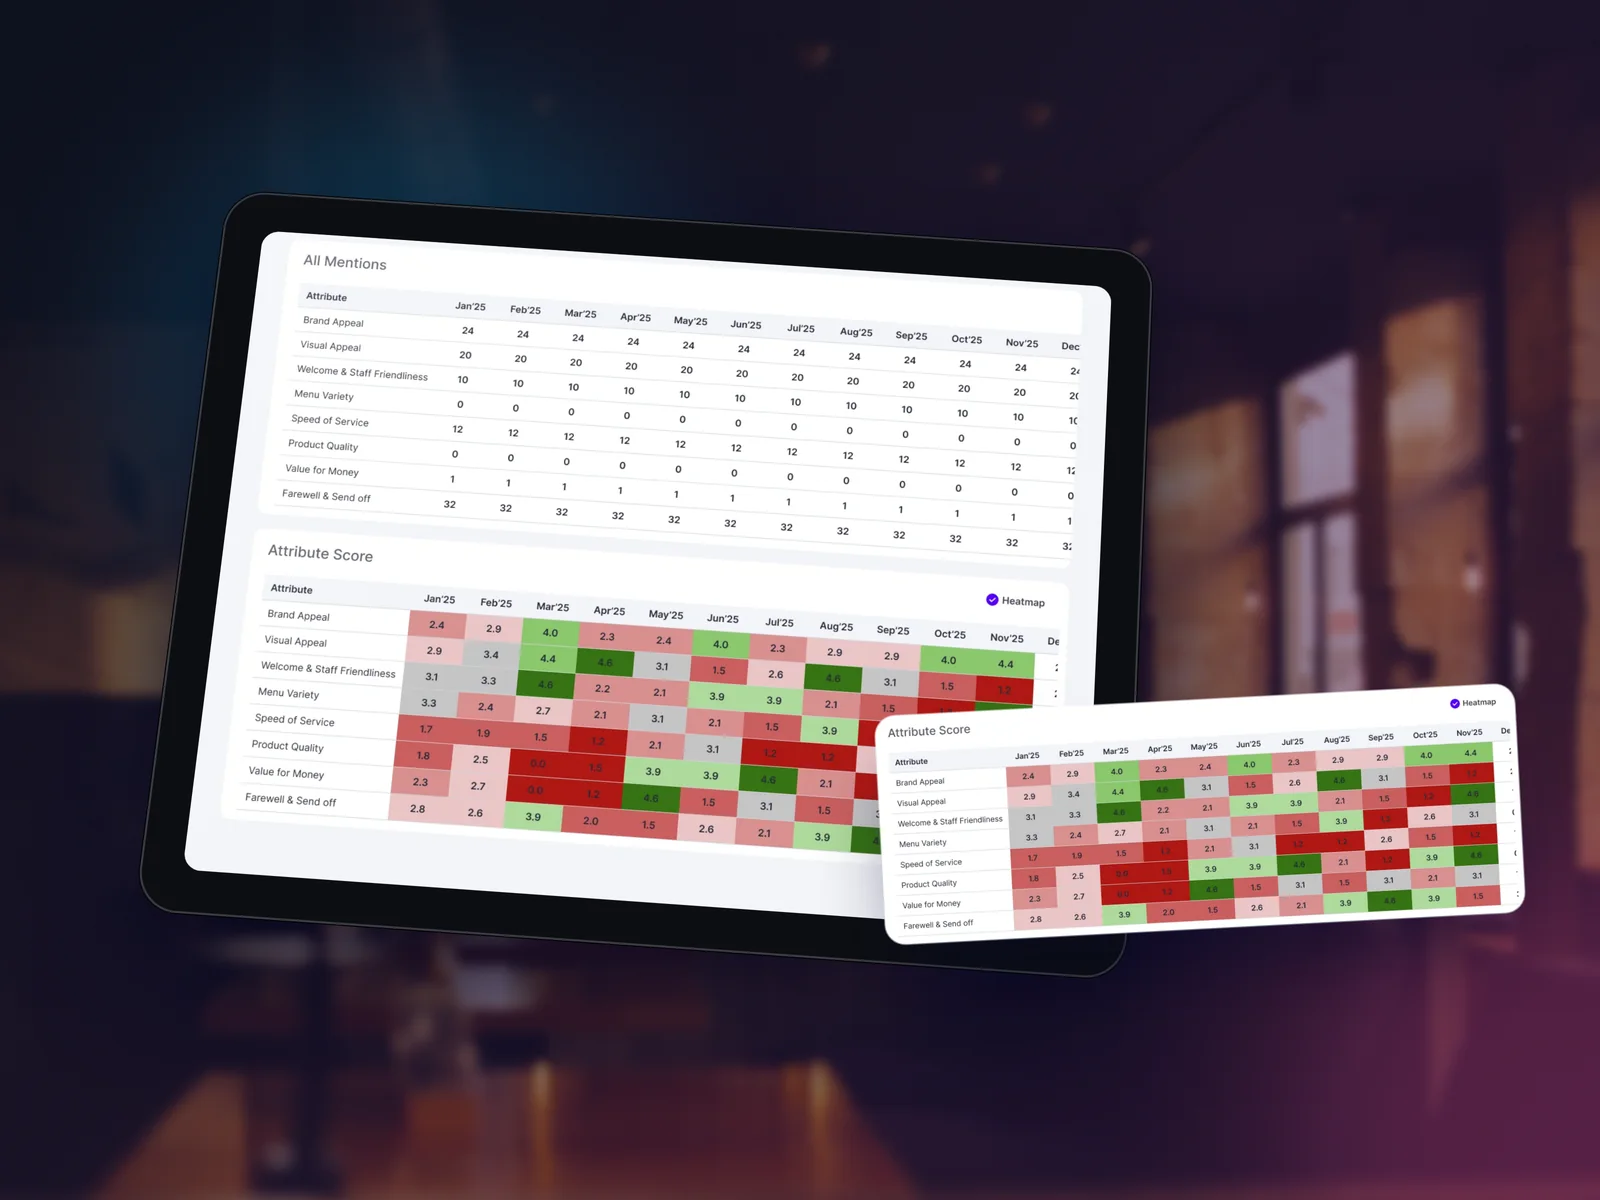
Show where scores slip

Why
A list of numbers hides patterns across months and attributes.
What I did
A colour‑coded heat map shows, month by month, exactly where the experience drops.
Attribute heat map

05 · The screens

A website and a dashboard

  • Hero
  • Meet Elara
  • Product
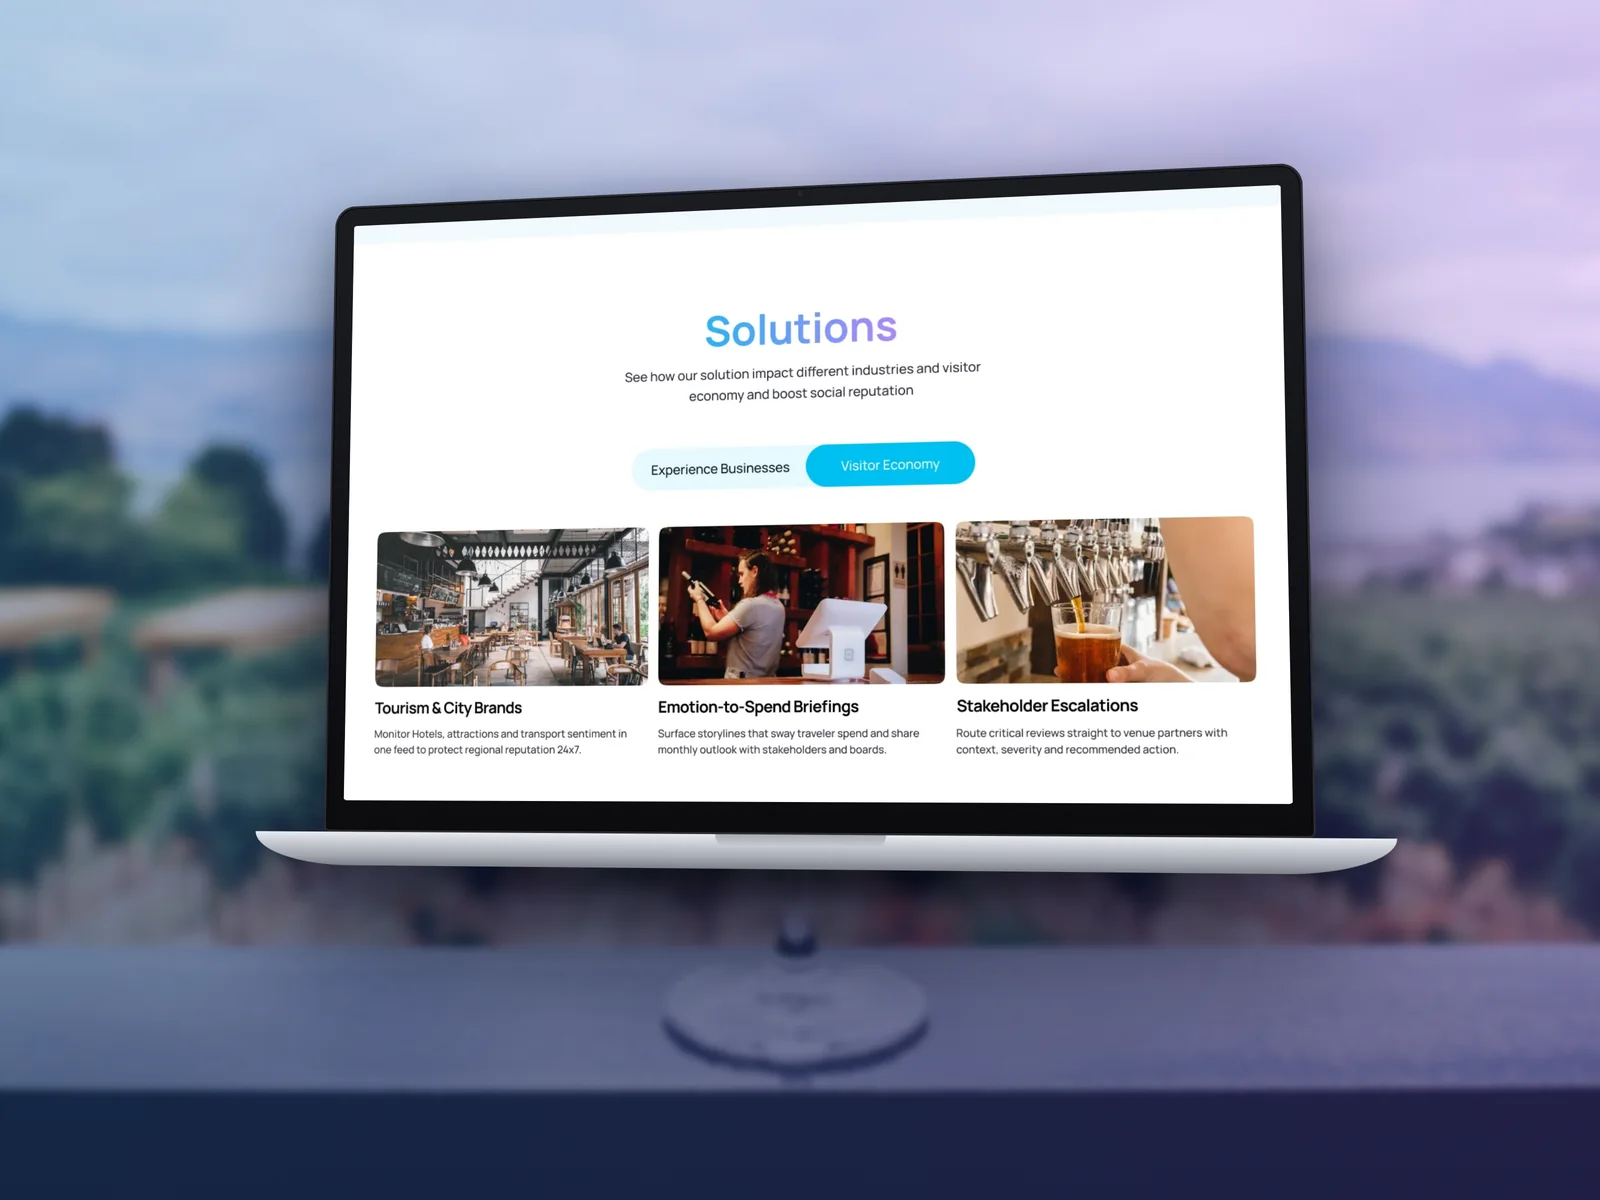
  • Solutions
  • Pricing
  • Overview
  • Attribute scores
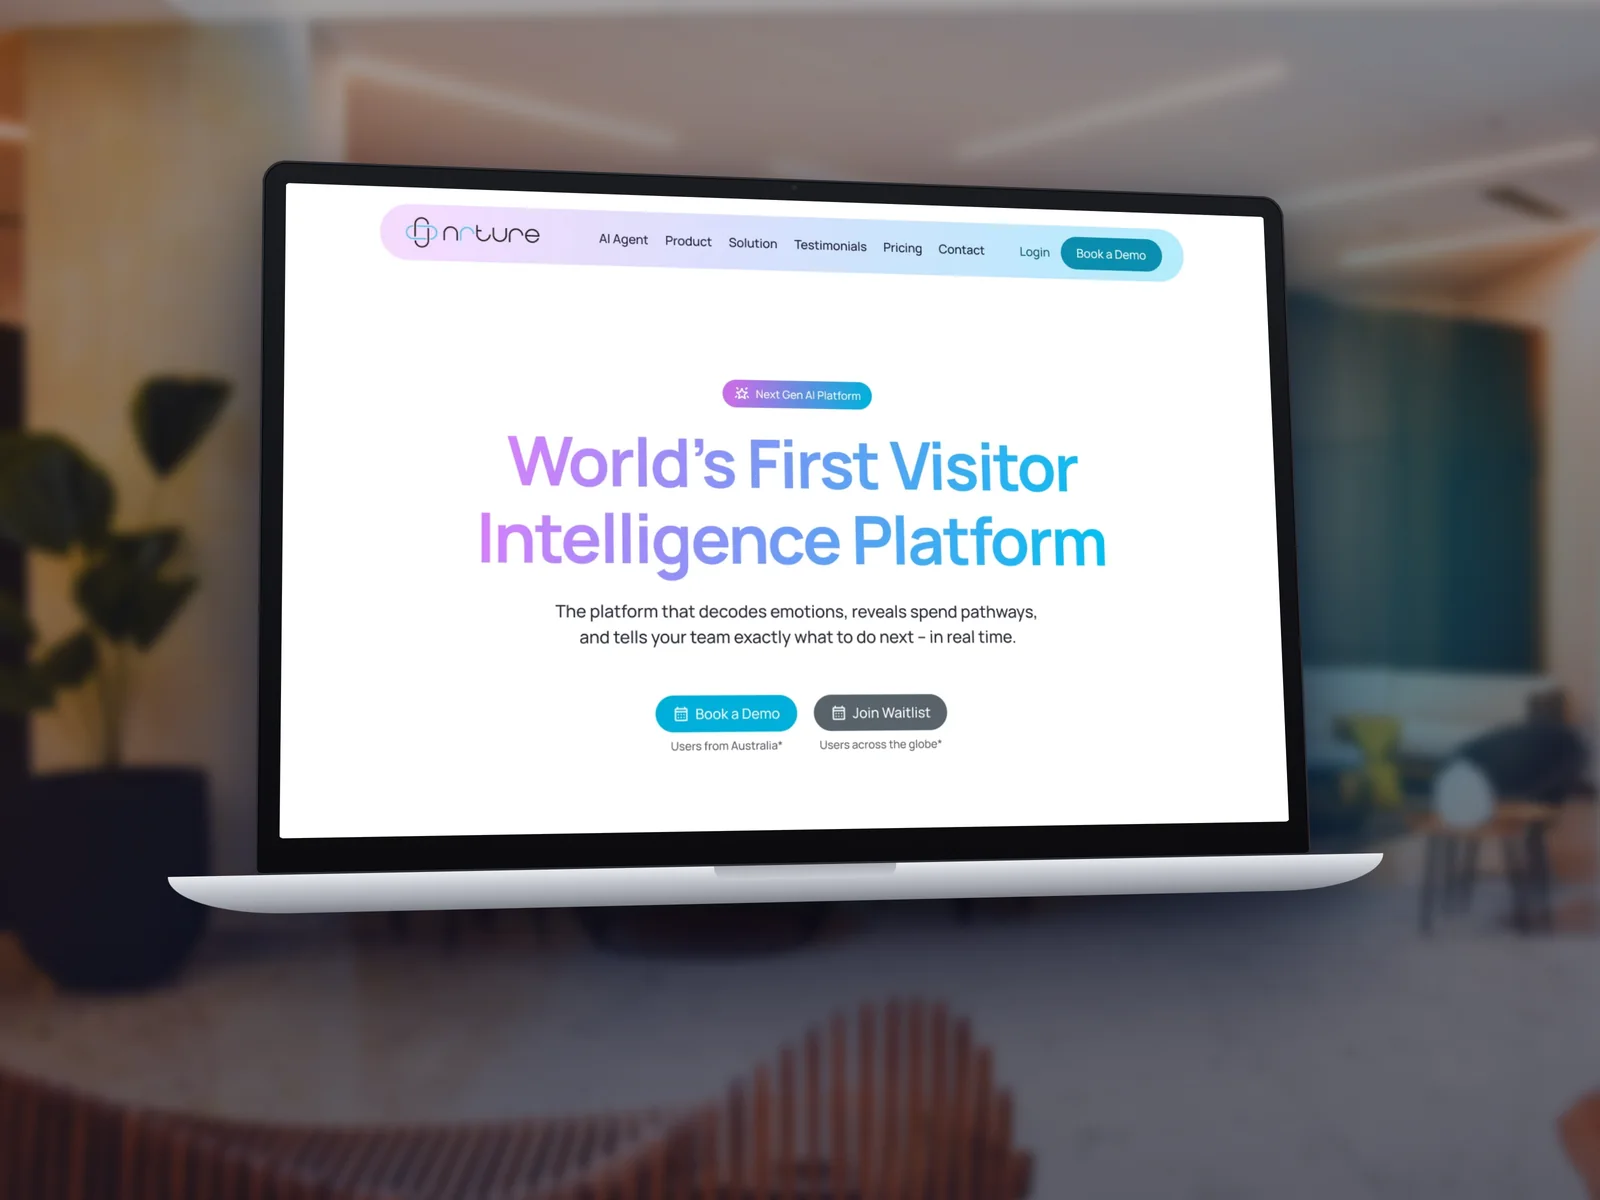
Website hero
Meet Elara
Explore product
Solutions
Pricing
Wine tourism dashboard overview
Attribute heat map

Building an AI product?

  • I make new, complex ideas easy to understand in the first scroll.
  • Dashboards that answer questions, not just show charts.
  • AI that feels human and on‑brand, so people trust it.

Next case study

ROKOSH →

A website as considered as the rooms it sells.
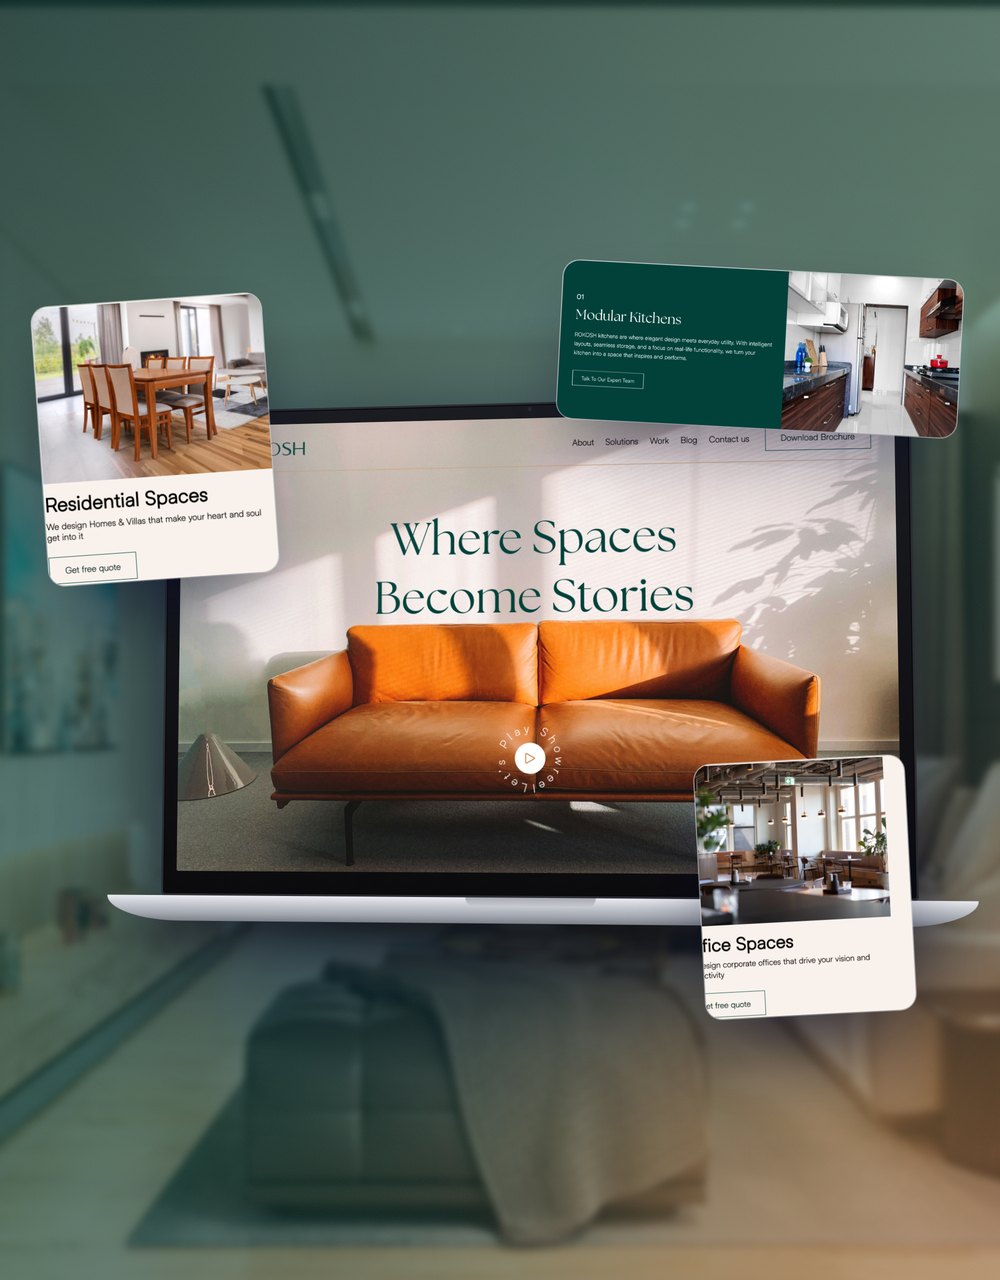
ROKOSH website mockup