Case study · Climate tech · SaaS module

The settings page that became a product.

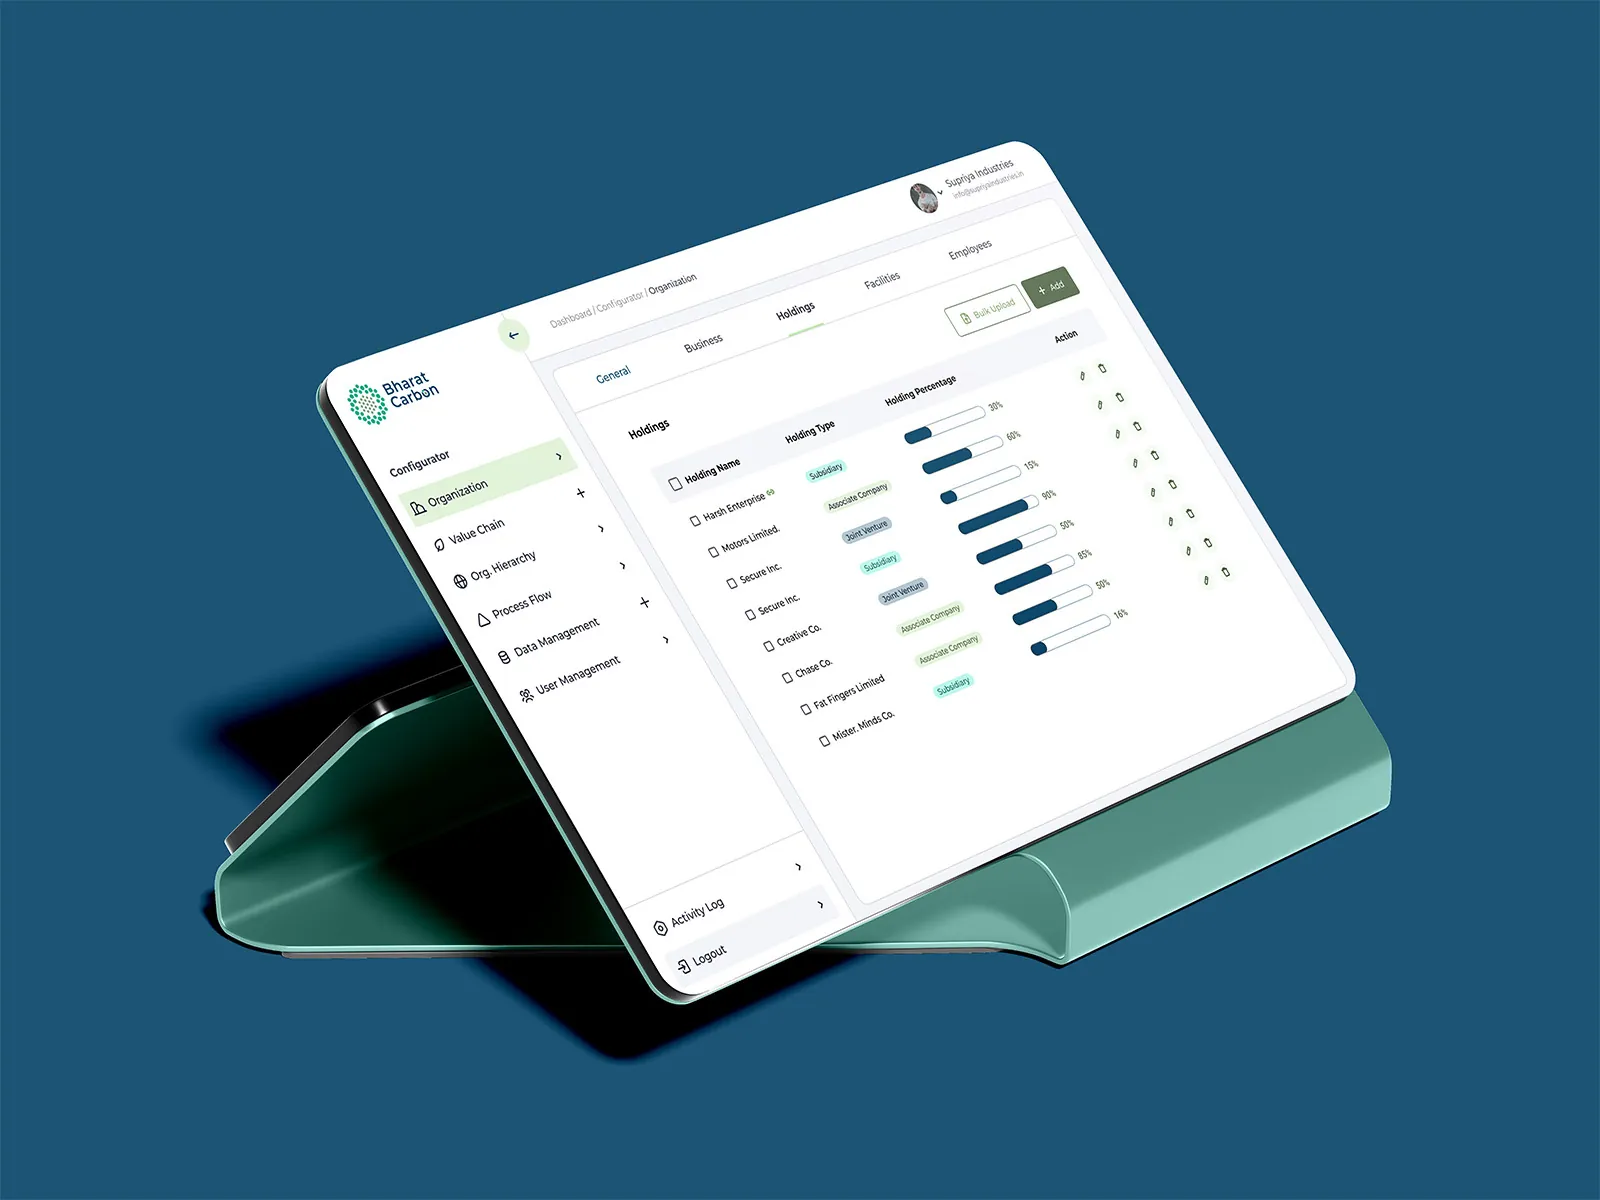
My Organization holds the core data every Bharat Carbon product runs on. I designed it to stay simple, even as it grew.
Client
Bharat Carbon
Industry
Climate tech · Carbon accounting & ESG
Product
Shared web module for a SaaS suite
Timeframe
4–6 weeks
My role
UX strategy, UX research, wireframing, visual design, prototyping
Tools
Figma, FigJam, Phase, Microsoft Teams
Links
Read on Medium
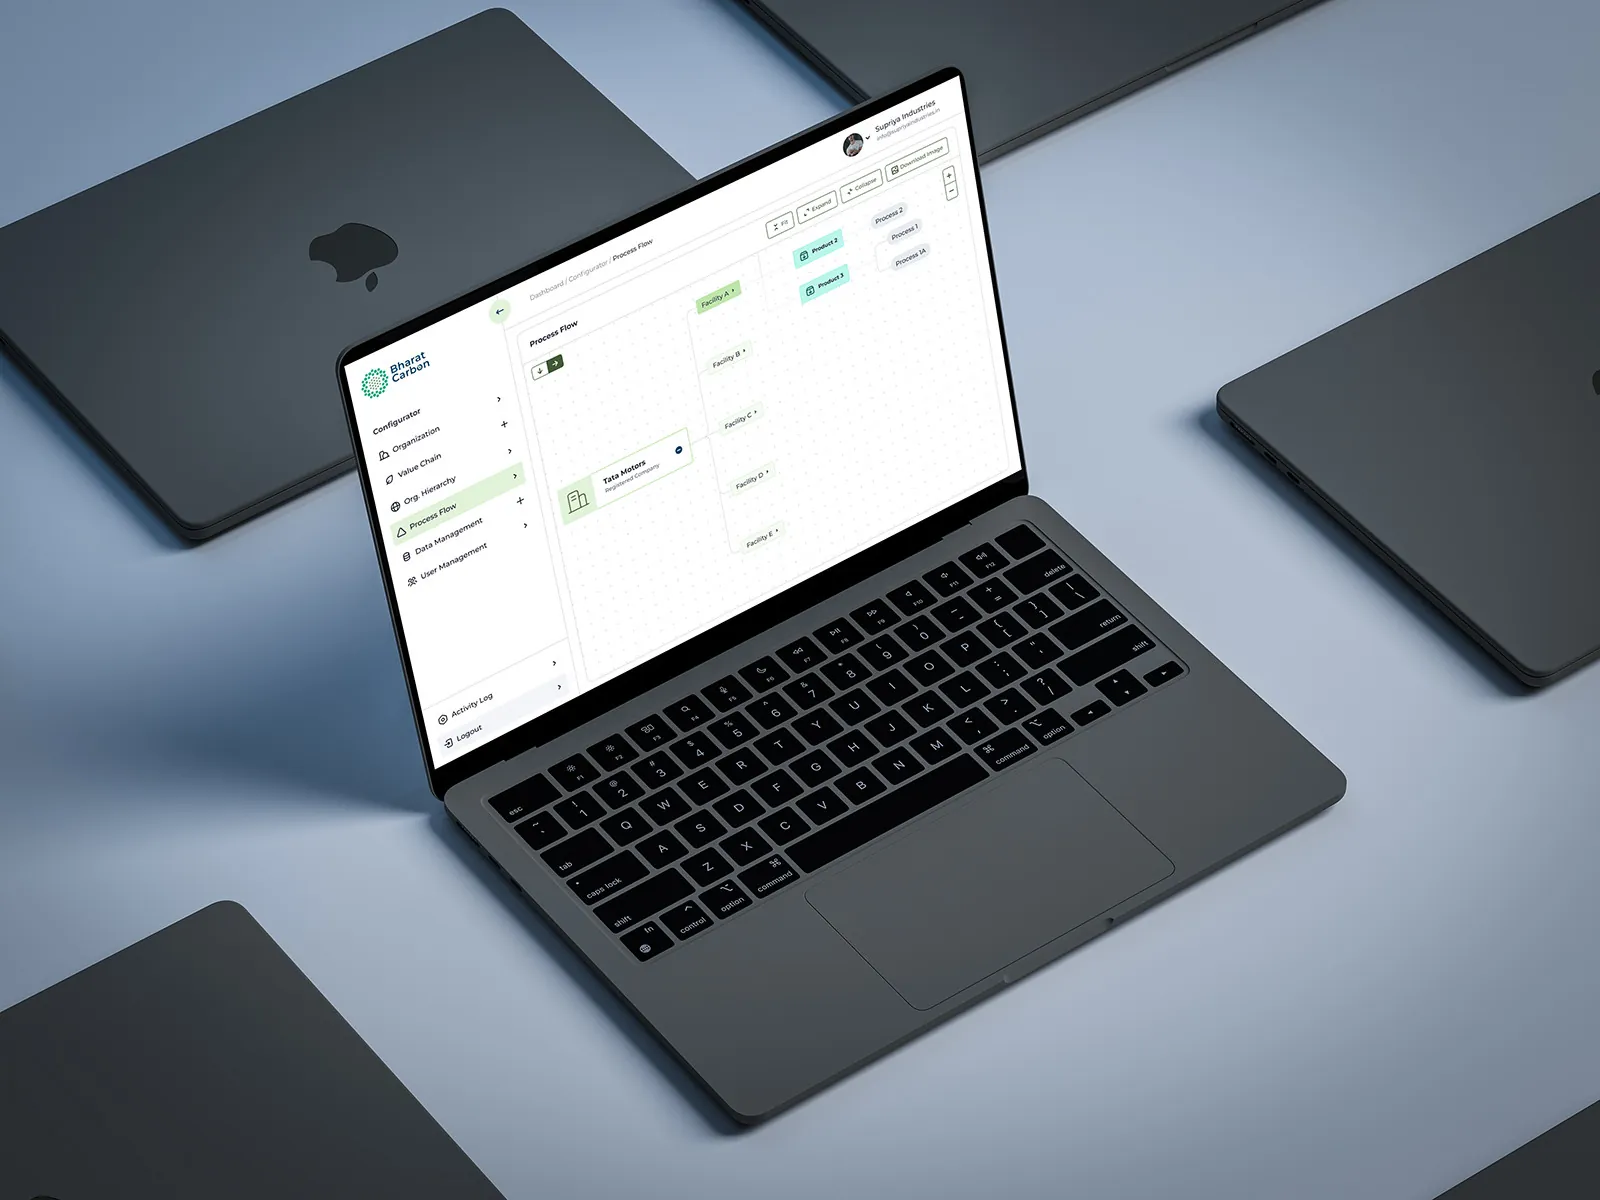
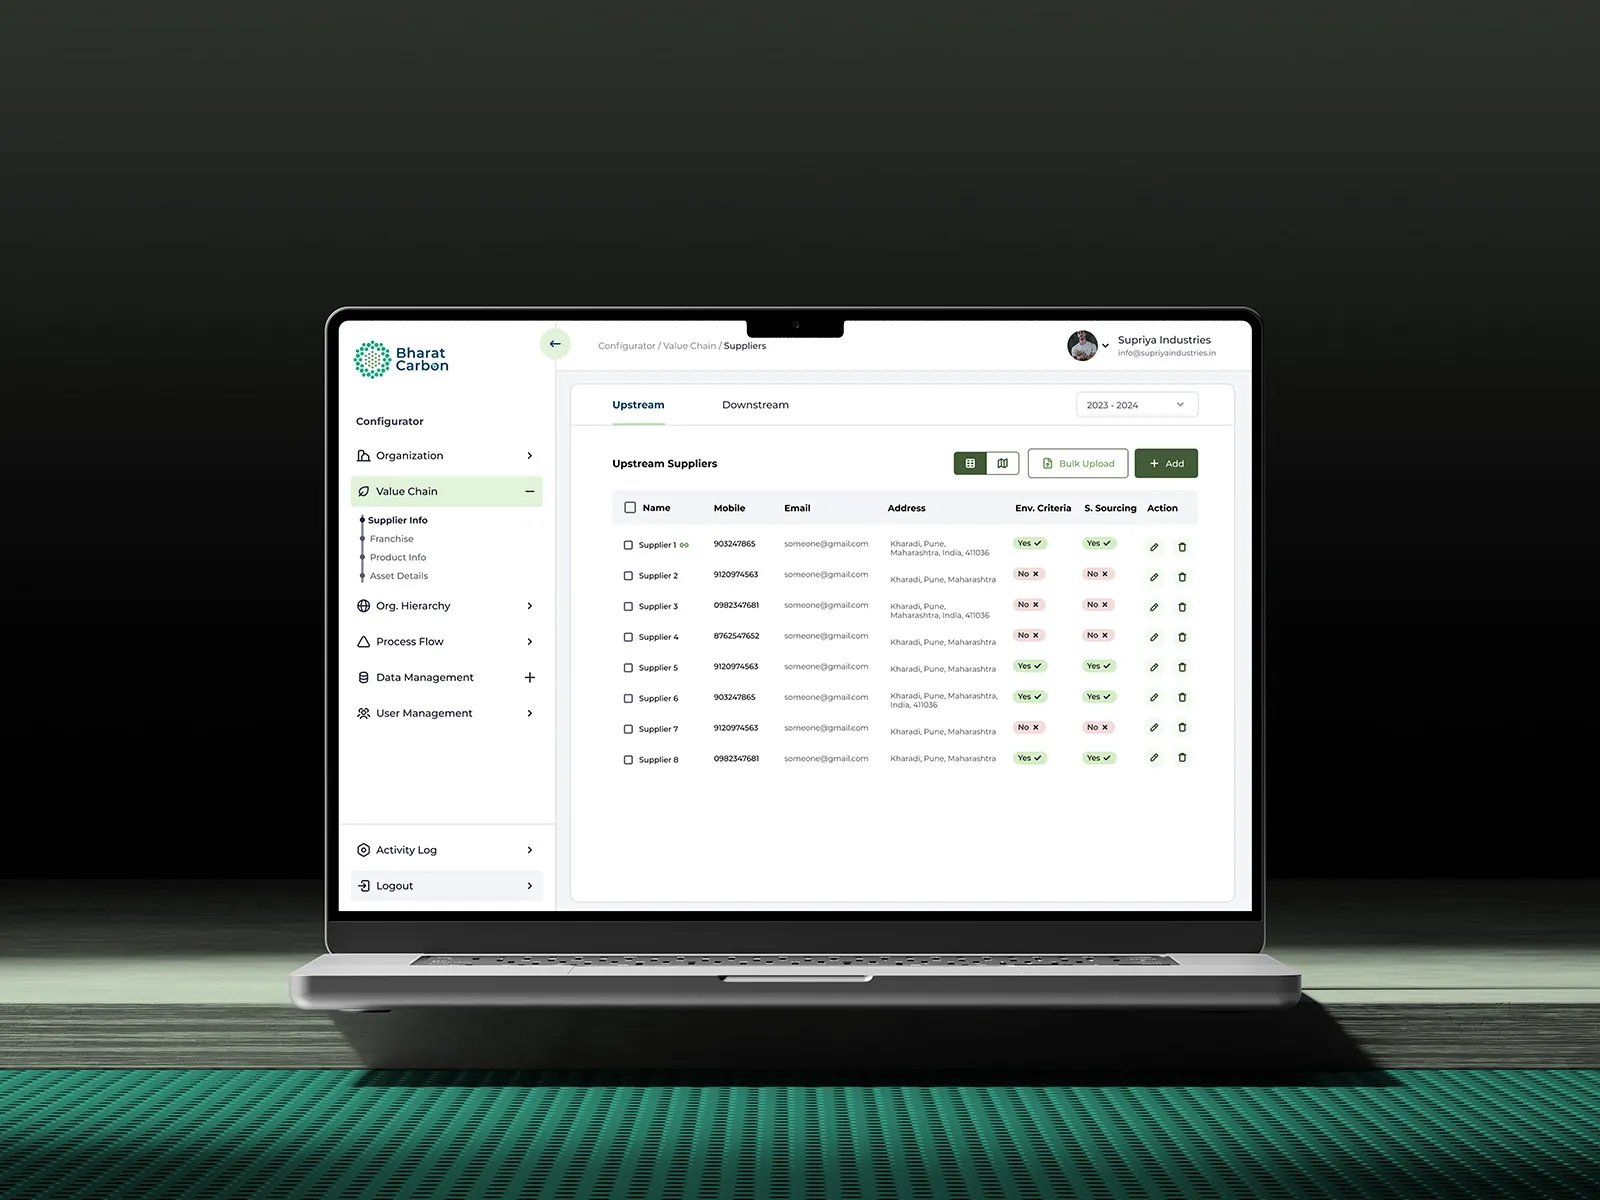
My Organization web app on a laptop

01 · The short version

The project in a minute

The problem

Not a simple settings page

It started as “Configurator”, but it held so much data and so many processes that it was really a product of its own.

What I did

Structure first, then screens

Fixed the information architecture, designed a clear navigation, and used side drawers so data entry never loses context.

The result

One source of truth

A central module that every Bharat Carbon product reads from, organised into six clear flows.

4–6weeks from strategy to prototype
6core user flows
5big challenges solved, from IA to user management
1shared module behind every product

02 · Who it's for

Used by the whole organisation

From admins setting up the company to staff adding suppliers, everyone touches this module. It had to work for all of them.

Primary users

Organisation‑wide staff

“Let me set up and update company data without getting lost in it.”The brief in one line, as I framed it

  1. Clear structureFix the information architecture before anything else.
  2. Easy navigationAlways know where you are and how to get back.
  3. Long lists, made calmTables of images, text and labels that stay readable.
  4. Data entry in contextAdd and edit without leaving the page.
  5. Simple user managementMany roles and staff, handled without confusion.

03 · How it came together

From a tangle to a system

The hard part wasn't the screens. It was deciding where everything should live.

  1. 1

    Step 1

    Untangle

    Listed every piece of data and process, then rebuilt the information architecture.

    • UX strategy
    • IA
  2. 2

    Step 2

    Structure

    Navigation for six areas, table patterns and side drawers for data entry.

    • Navigation
    • Wireframes
  3. 3

    Step 3

    Polish

    Visual design and prototypes for every flow, ready for the product team.
    • Visual design
    • Prototype
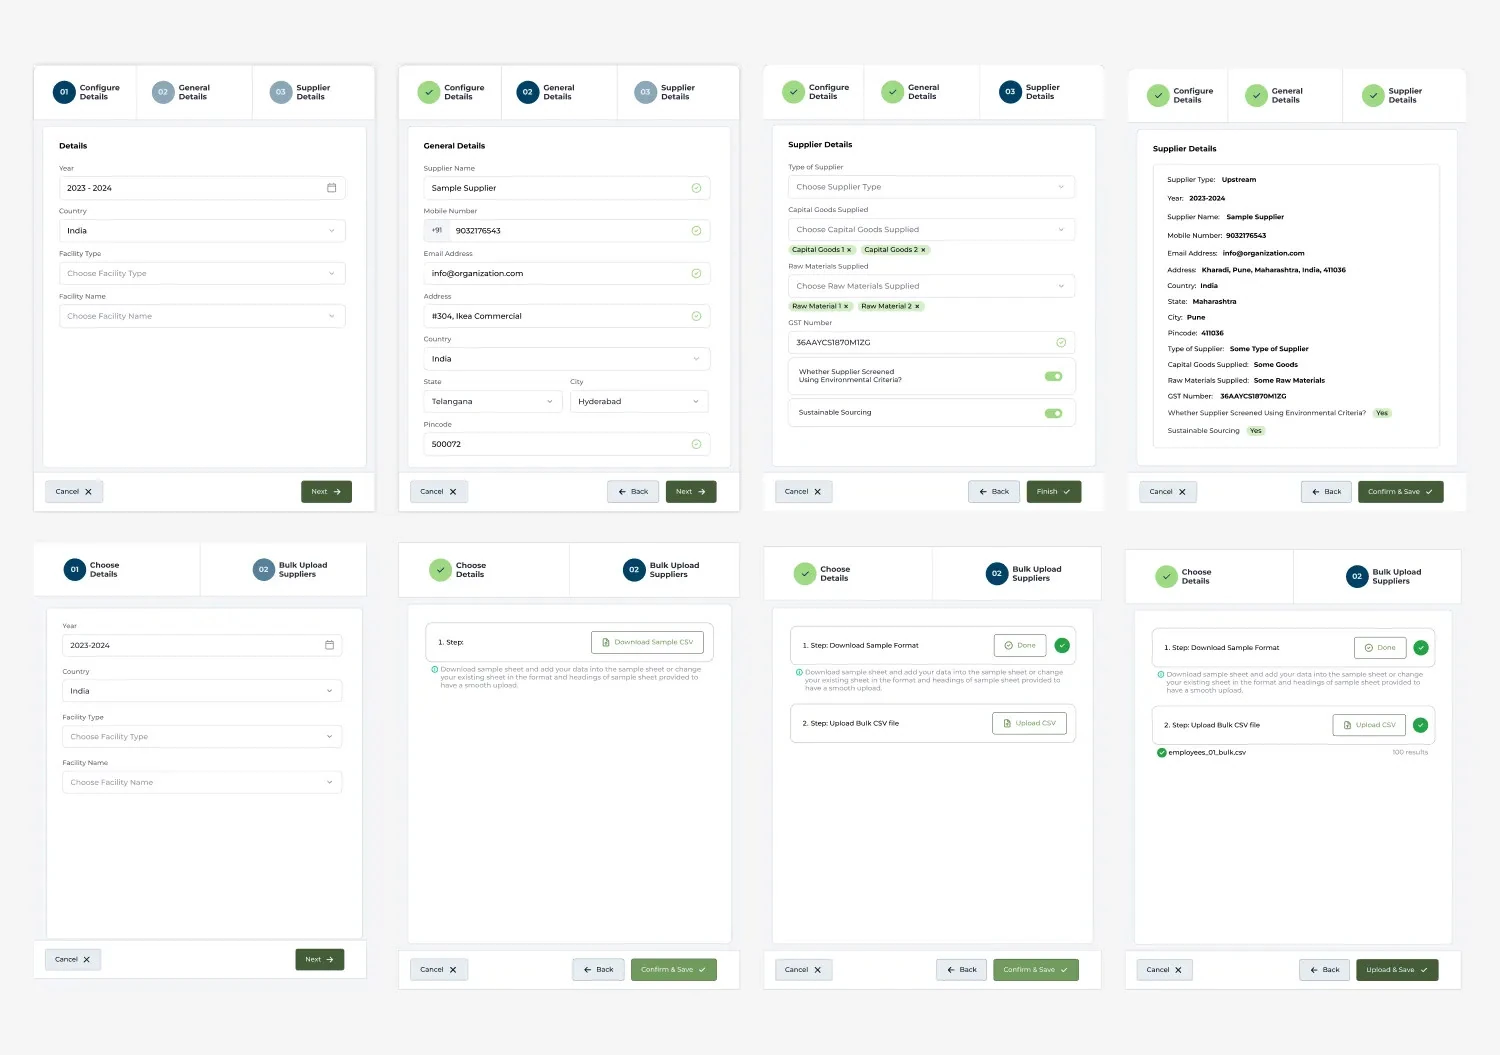
Side drawer designs
The side drawers: every add and edit form opens beside the list, so you never lose your place.

04 · Key decisions

The choices that made it work

Decision 01

Side drawers, not new pages

Why
Staff add lots of records in a row. Jumping between pages loses their place.
What I did
Forms open in a drawer beside the list, so you can add, check and add again without leaving.
Form open in a side drawer

Decision 02

Tables built for long lists

Why
Some sections hold never‑ending lists of images, text, labels and linked items.
What I did
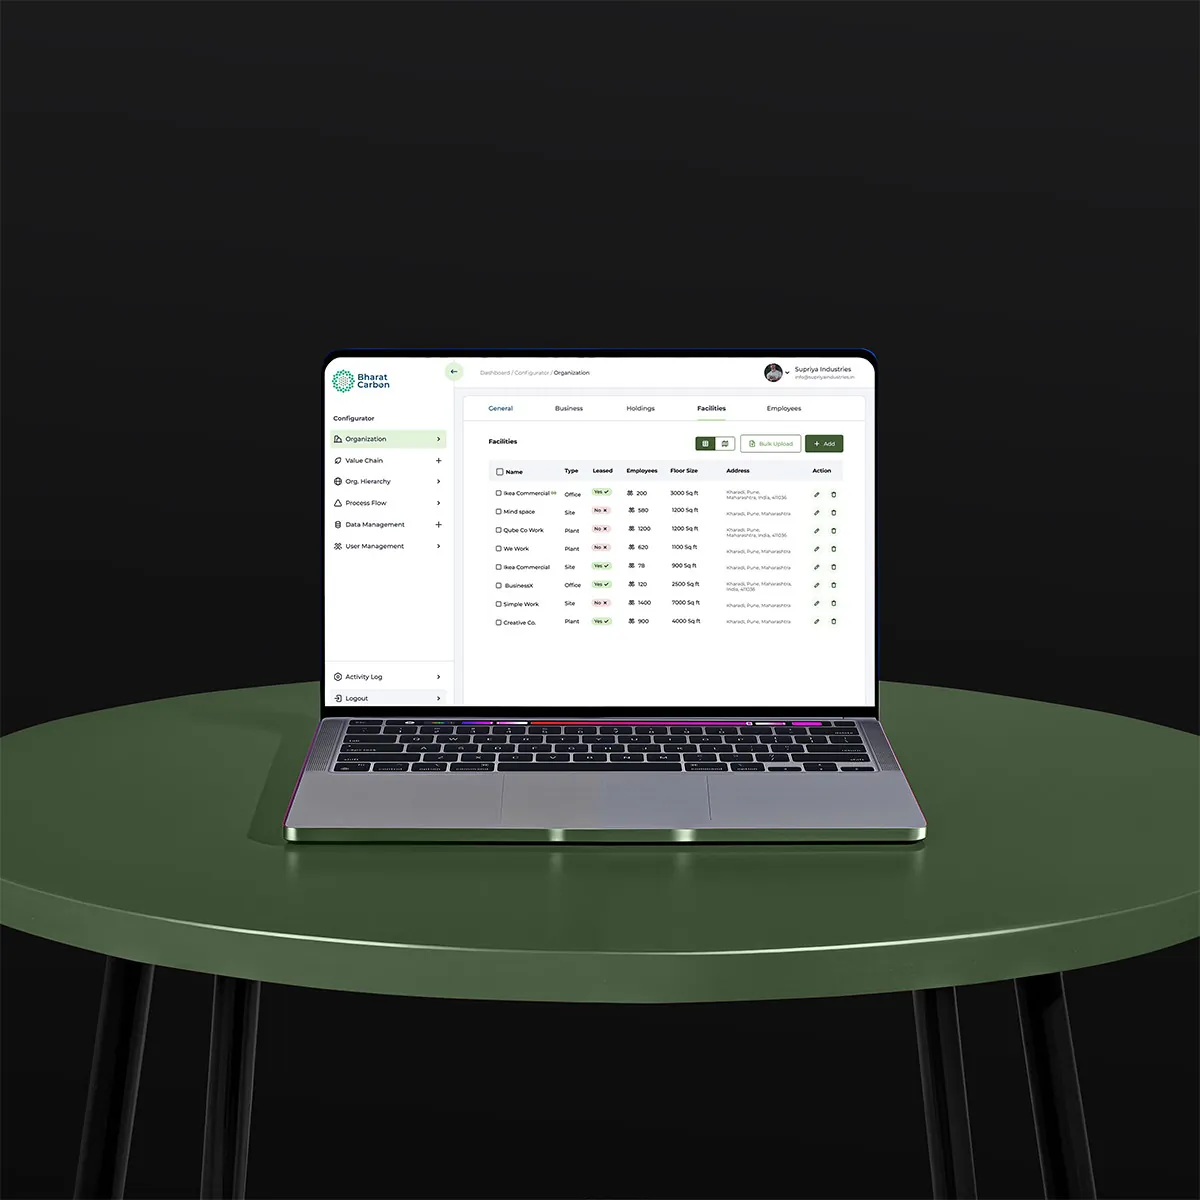
Clear columns, status labels, search and filters keep even long tables easy to scan.
Data table screen

Decision 03

Navigation that mirrors the company

Why
People think about their company by its parts: structure, suppliers, processes, people.
What I did
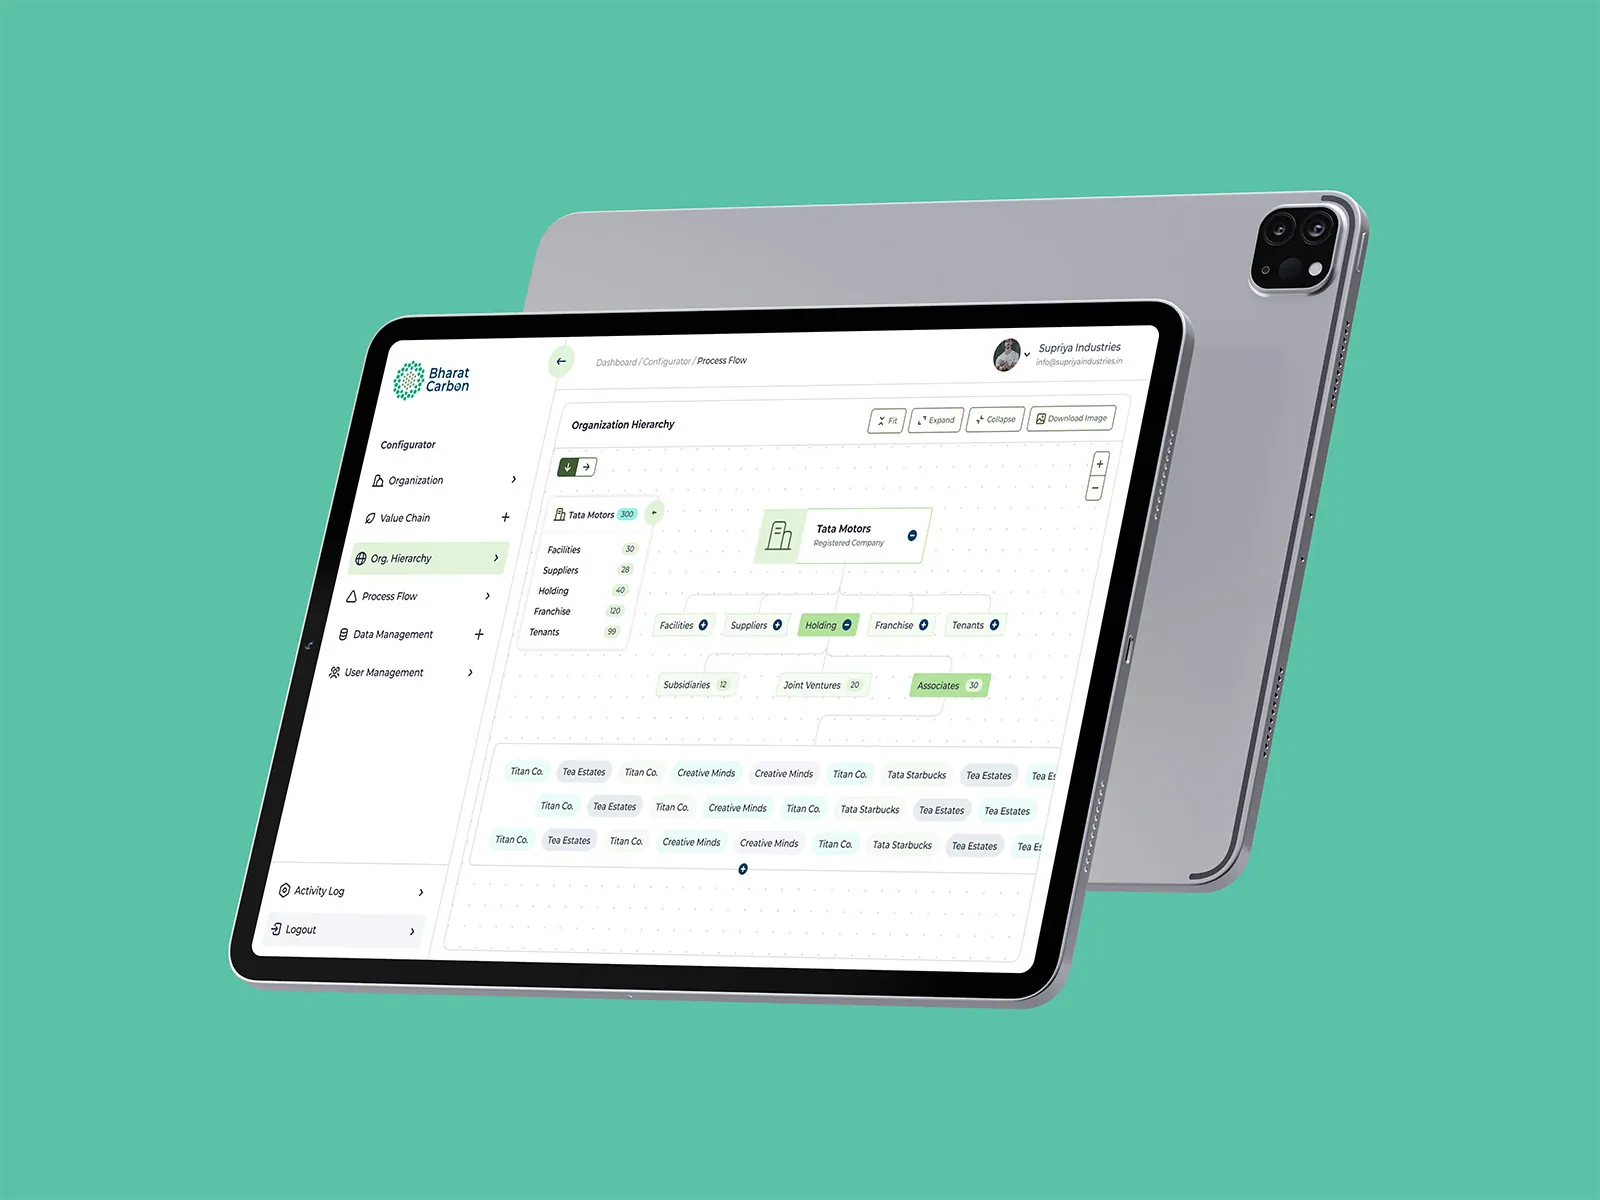
Six areas sit in a fixed side menu, in the same order every time, from organisation to user management.
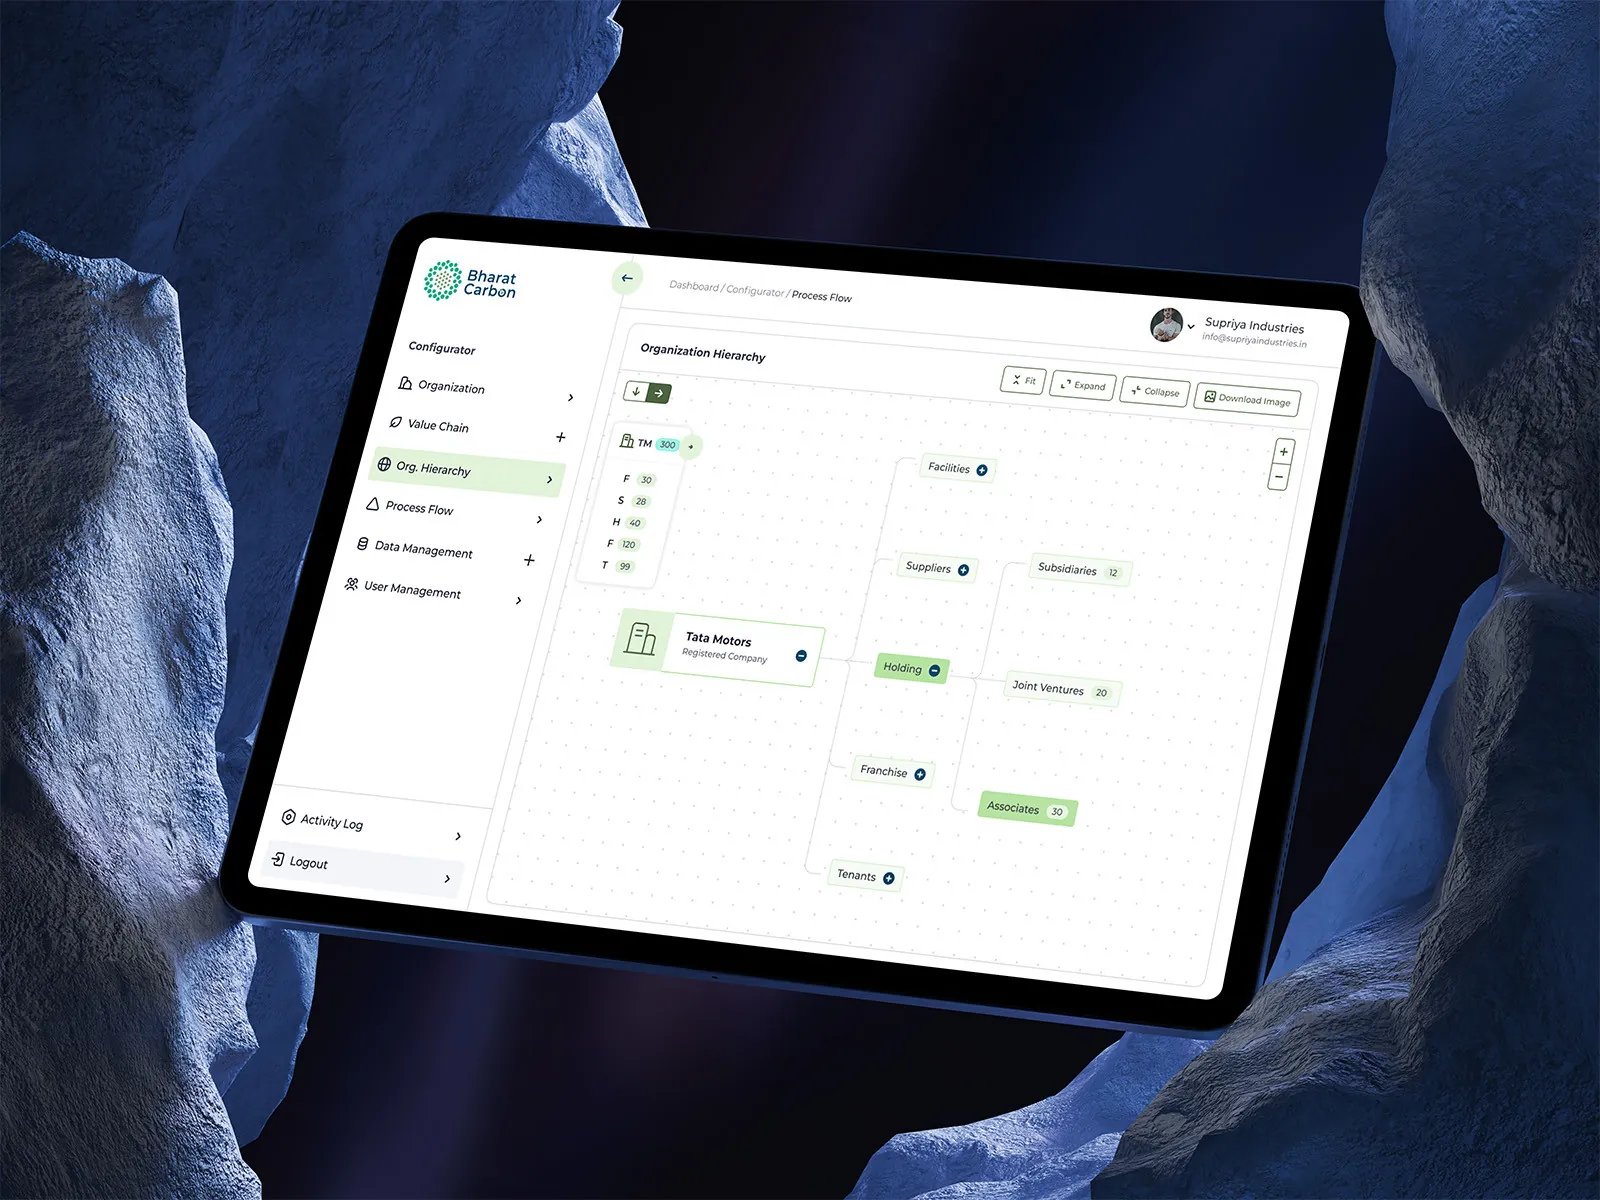
Organisation hierarchy screen

05 · The screens

Six flows, one source of truth

  • Organization
  • Value chain
  • Org hierarchy
  • Process flow
  • Data management
  • User management
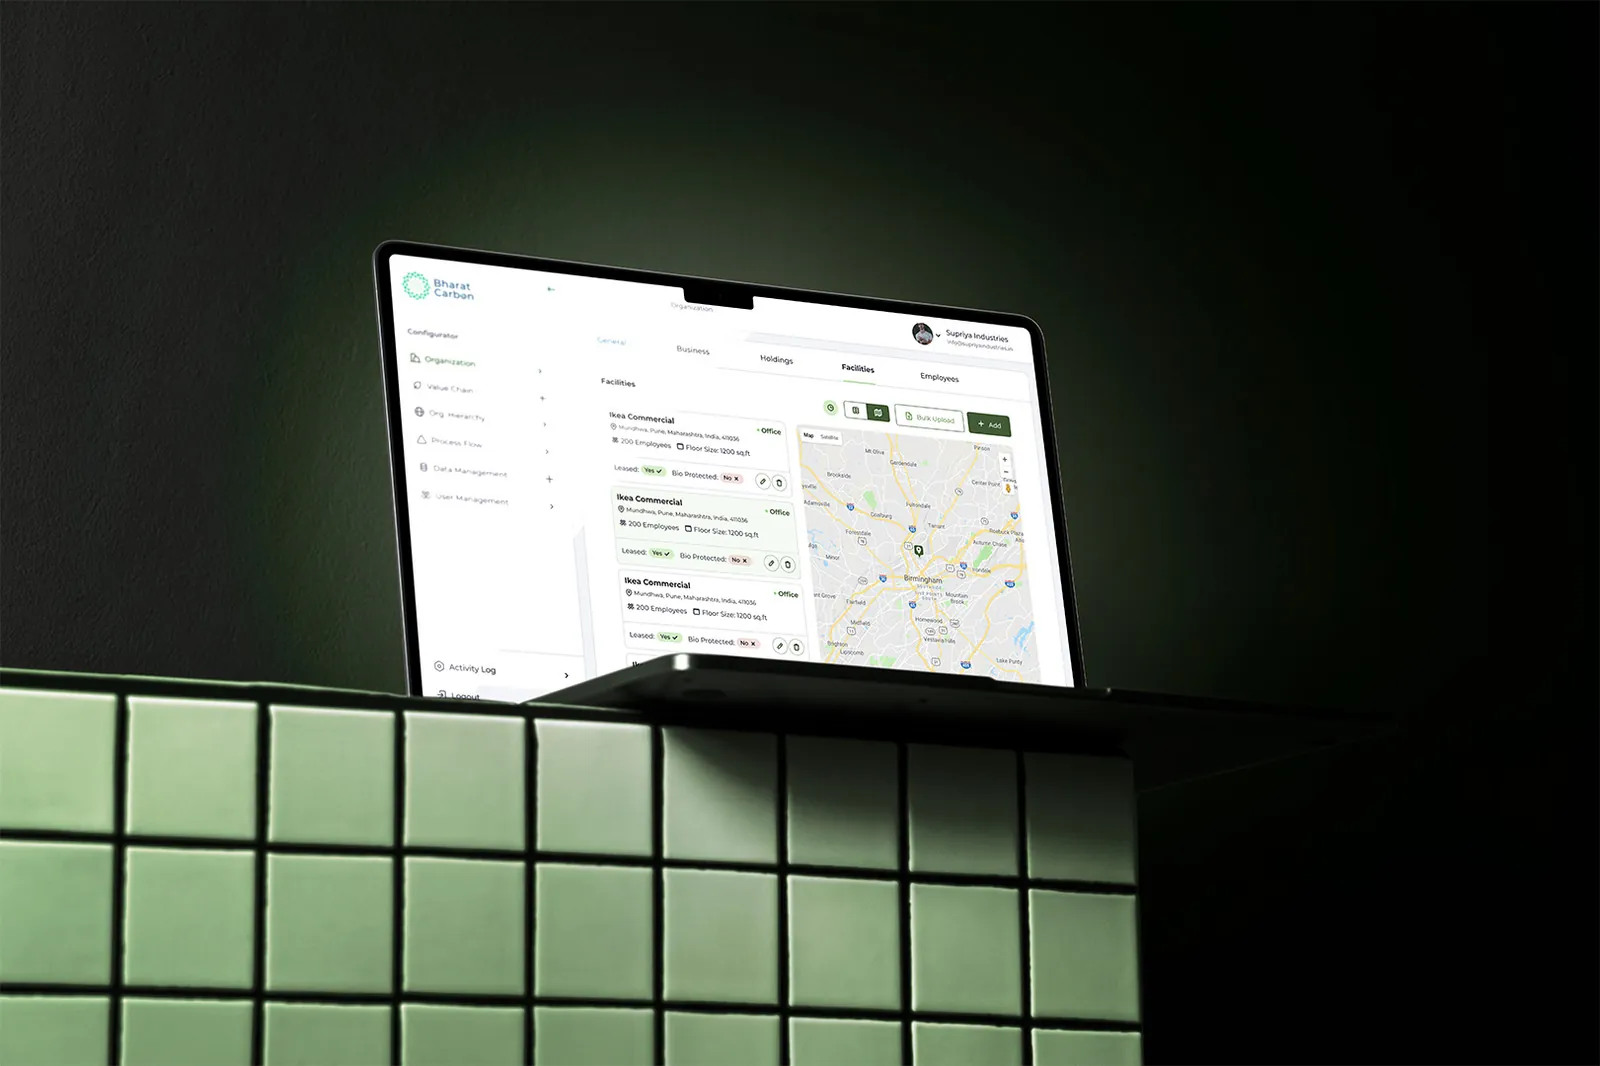
Organization with map
Value chain data
Data table
Organisation hierarchy
Process flow list
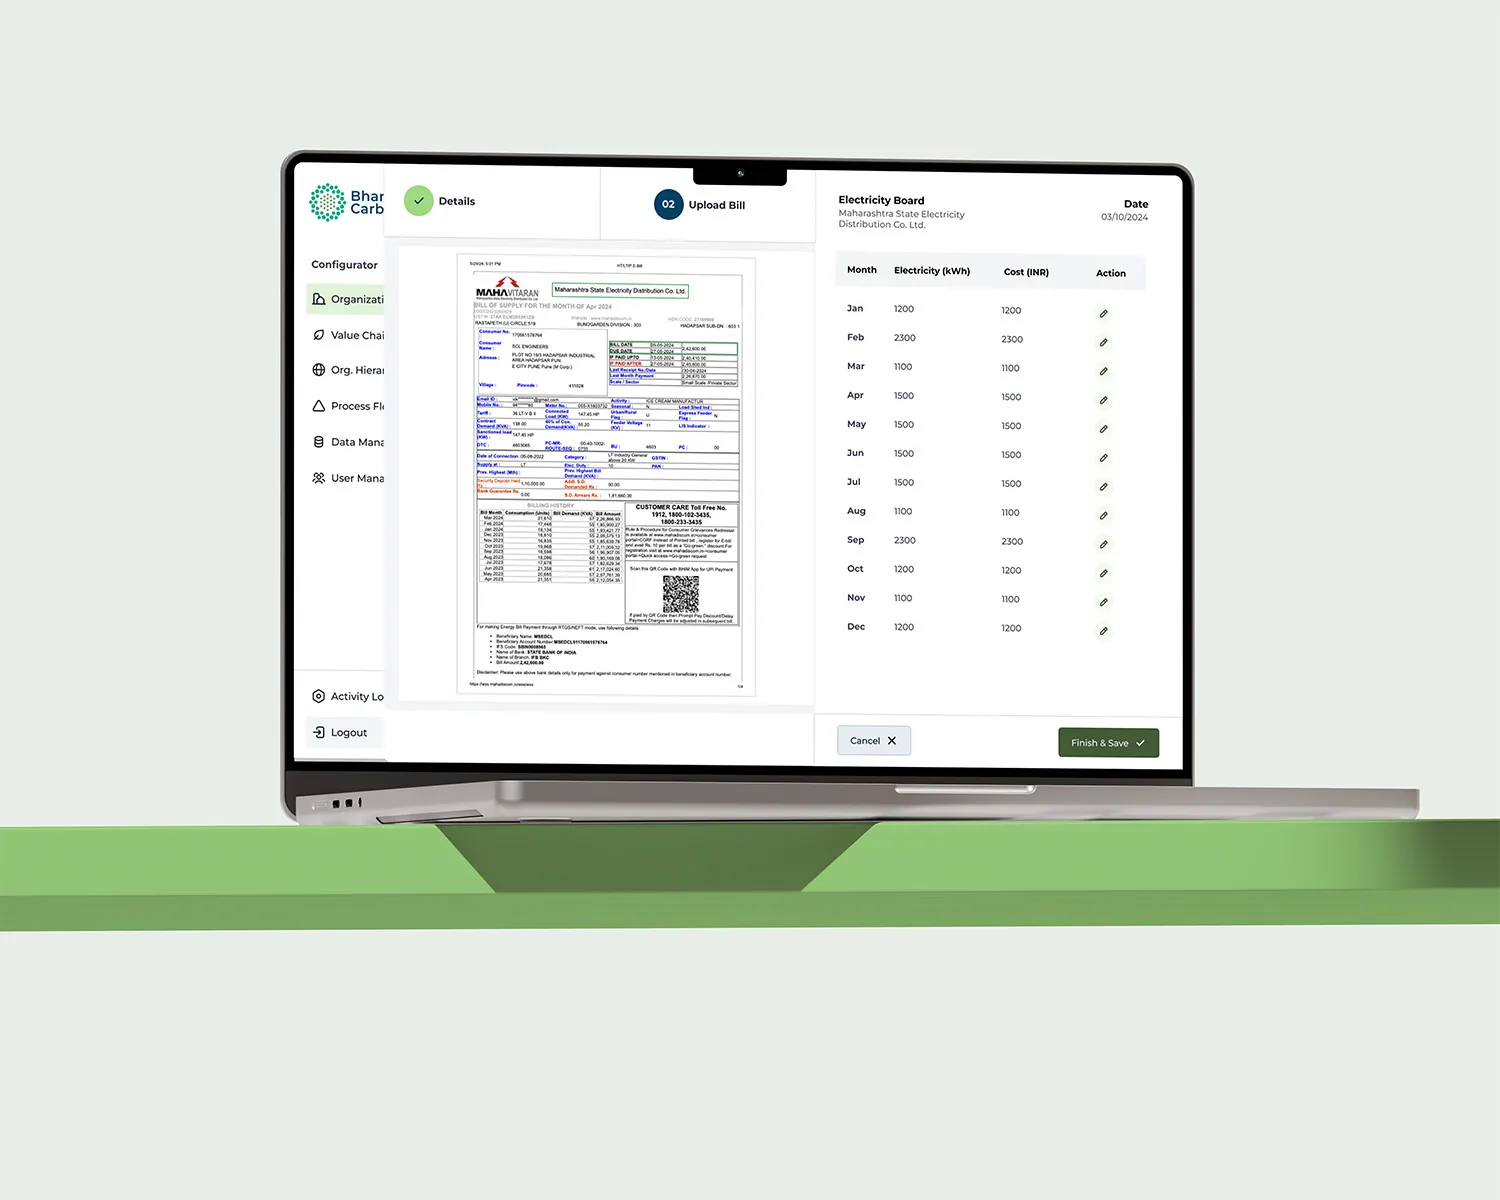
Document management
User management

Is your admin area a maze?

  • I bring structure to modules that grew without a plan.
  • Tables, forms and navigation that stay calm with lots of data.
  • UX strategy as well as screens, so the product scales.

Next case study

Nexapol →

A modern website for a polymers manufacturer.
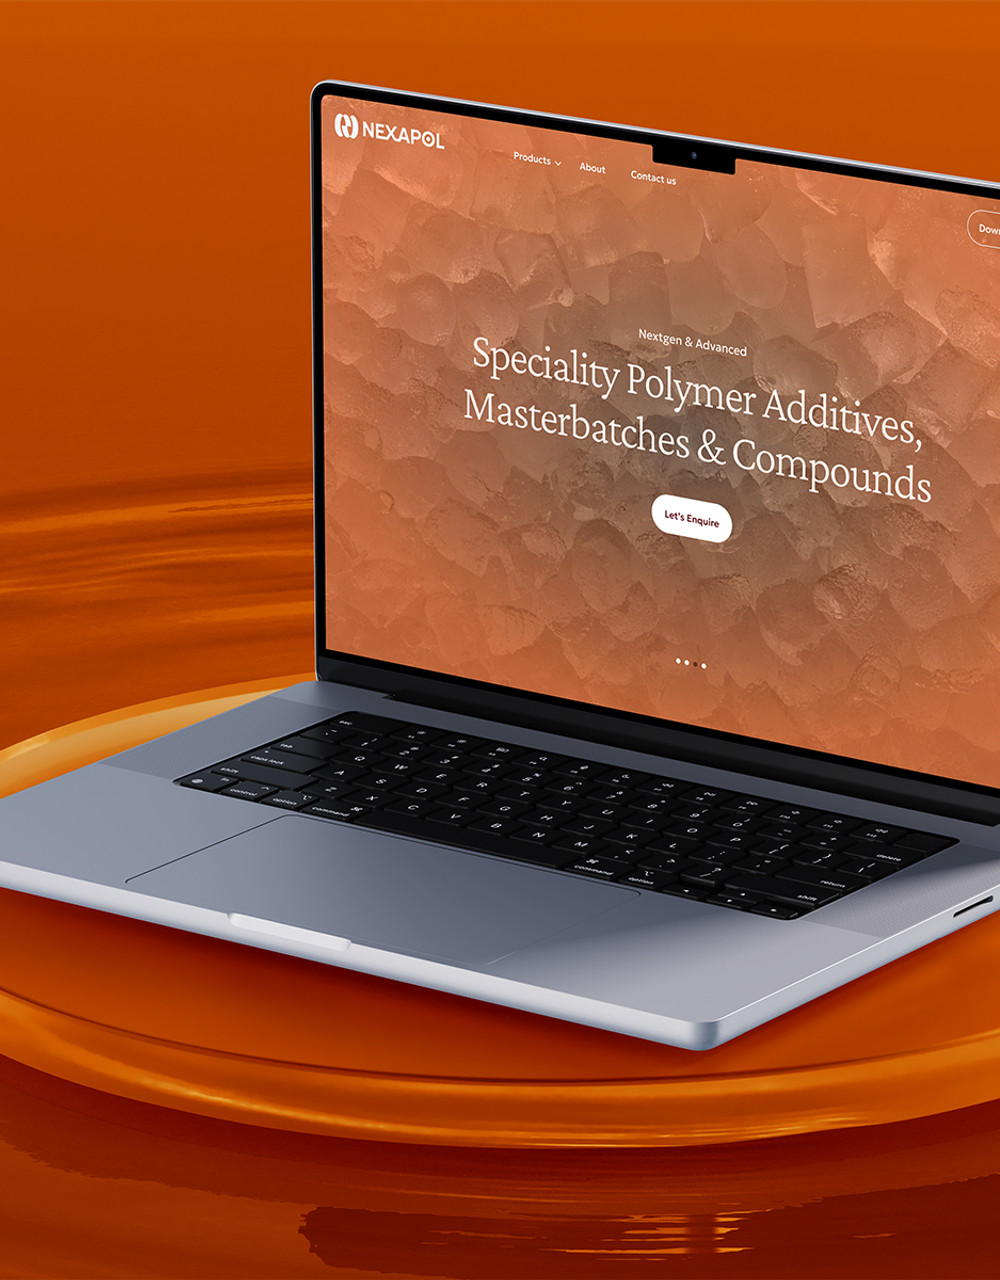
Nexapol website