Case study · Climate tech · Mobile app

Carbon data a busy CEO can read on the go.

A light mobile companion to the Bharat Carbon dashboard, so leaders see emissions, consumption and strategy between meetings.
Client
Bharat Carbon
Industry
Climate tech · Carbon accounting & ESG
Product
Mobile app for C‑suite leaders
Timeframe
3 weeks
My role
UX research, user interviews, wireframing, visual design, prototyping
Tools
Figma, FigJam, Phase, Microsoft Teams
CEO App on a phone

01 · The short version

Read this if you only have a minute

The problem

Great data, wrong place

I had already designed a detailed web dashboard for Bharat Carbon. But leaders on the move needed a quicker way to check carbon and ESG progress.

What I did

Cut it down to what matters

Talked to the people who'd use it, then rebuilt the experience around four modules and seven short flows for the phone.

The result

A check‑in, not a report

A fast, light app that shows only the metrics leaders act on, designed and prototyped in three weeks.

3weeks from kickoff to clickable prototype
7user flows, from sign‑in to solutions
4data modules: emission, consumption, strategy, solutions
5design rules taken straight from user needs

02 · Who it's for

Designed for people with no time

CEOs, CXOs, VPs and department heads check in for a few minutes at a time. Every screen had to earn its place.

Primary users

CEOs · CXOs · VPs · Heads

“A few minutes between meetings. Show me what changed, and nothing else.”The brief in one line, as I framed it

  1. FastNo waiting. Insights open instantly.
  2. LightSmall and smooth on any phone.
  3. EffortlessSimple flows with nothing to learn.
  4. Visually engagingClear, bold visuals that catch the eye.
  5. Insight‑drivenOnly the most useful metrics, straight to the point.

03 · How it came together

Three weeks, three steps

A short project needs a tight plan. Here's how the time was spent.

  1. 1

    Week 1

    Listen

    User interviews with leaders, a review of the web dashboard, and a new information architecture.

    • Interviews
    • IA
  2. 2

    Week 2

    Shape

    User flows and wireframes for all seven journeys, tested early with the team.

    • User flows
    • Wireframes
  3. 3

    Week 3

    Polish

    Visual design, a colour for each module, and a clickable prototype ready for handoff.
    • Visual design
    • Prototype
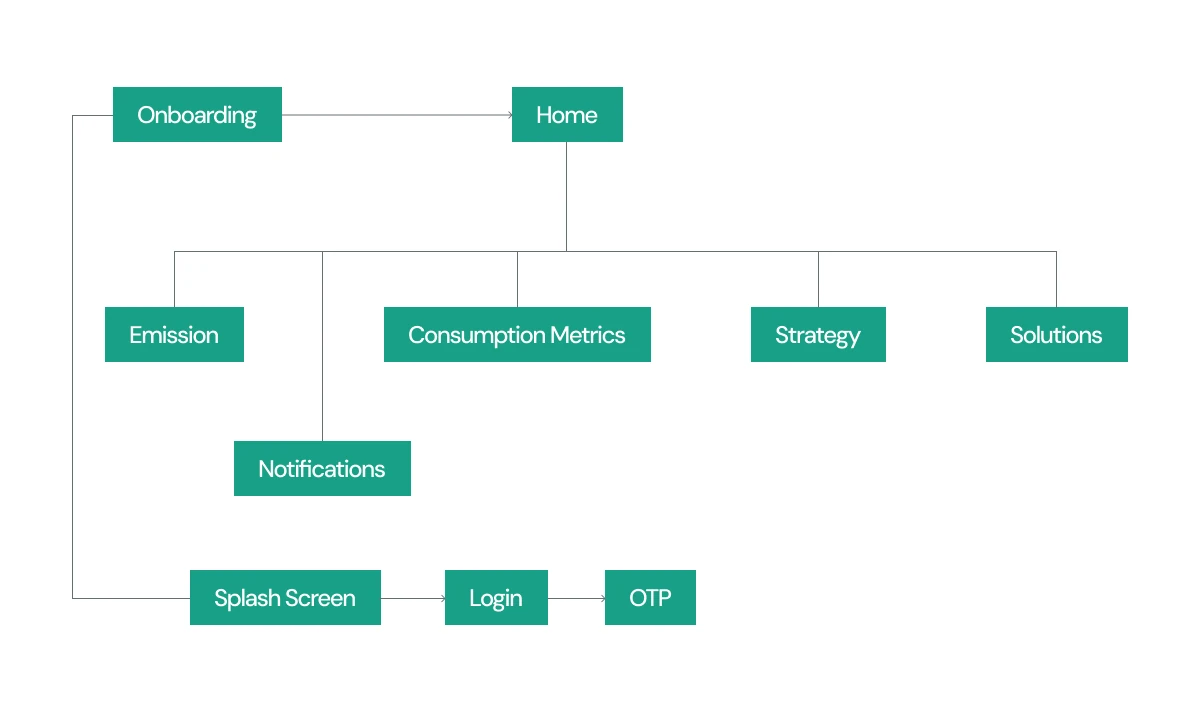
CEO App information architecture
The information architecture: onboarding leads to a home with four modules and notifications.

04 · Key decisions

The choices that made it work

Decision 01

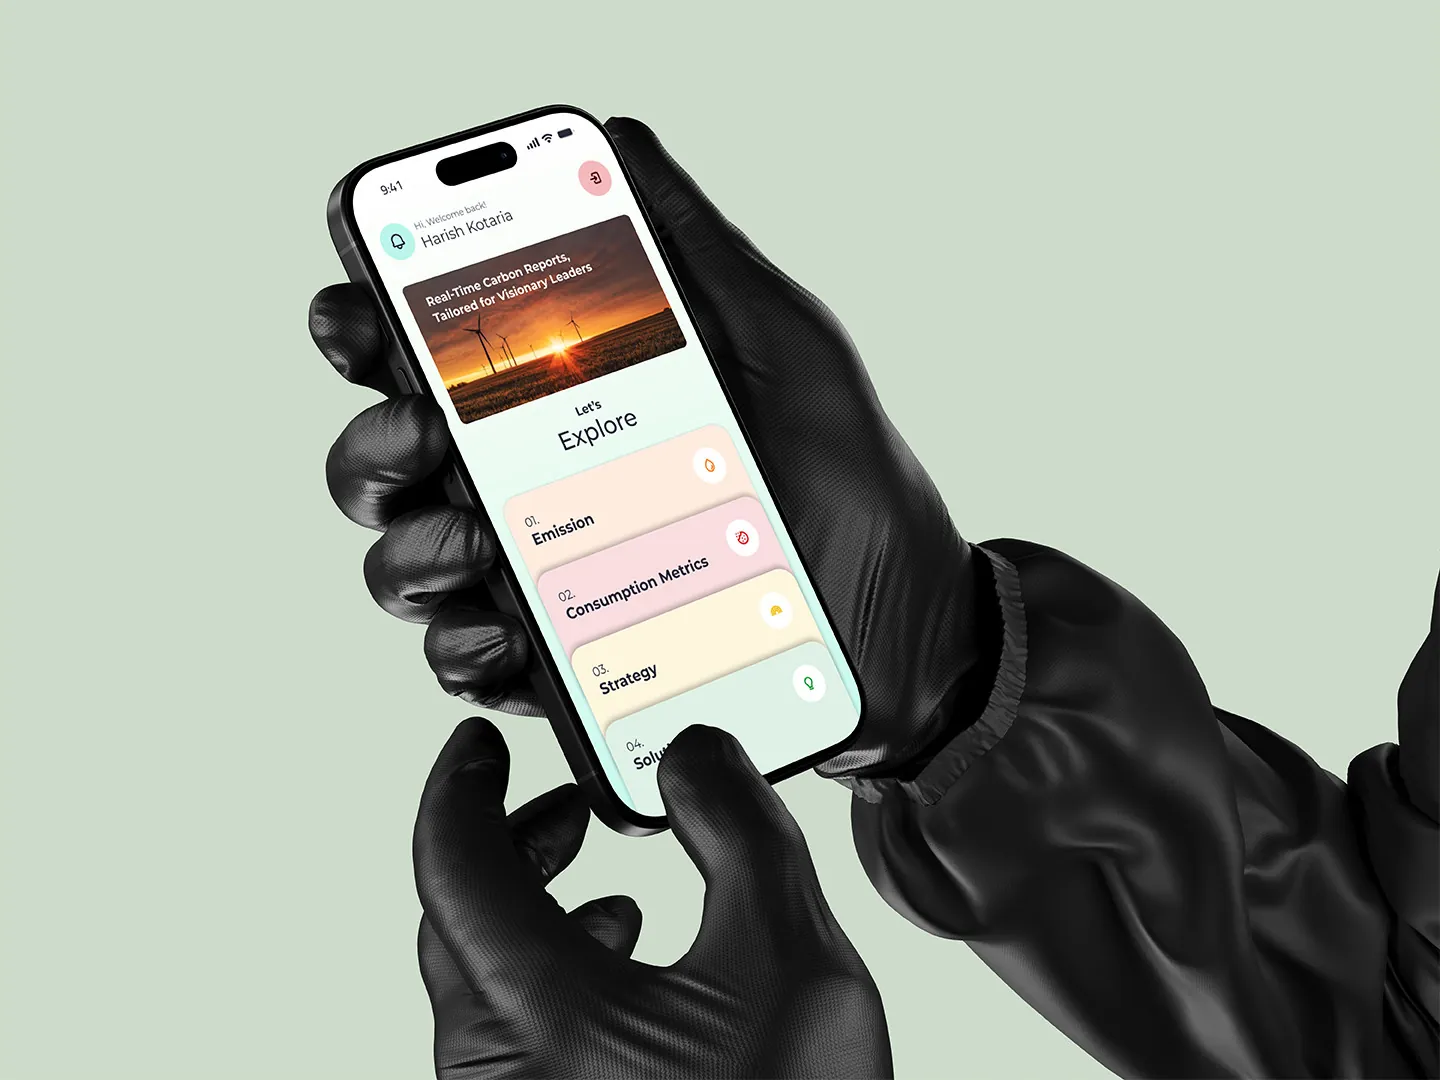
Home answers one question first

Why
Leaders open the app to see how things are going, not to explore filters.
What I did
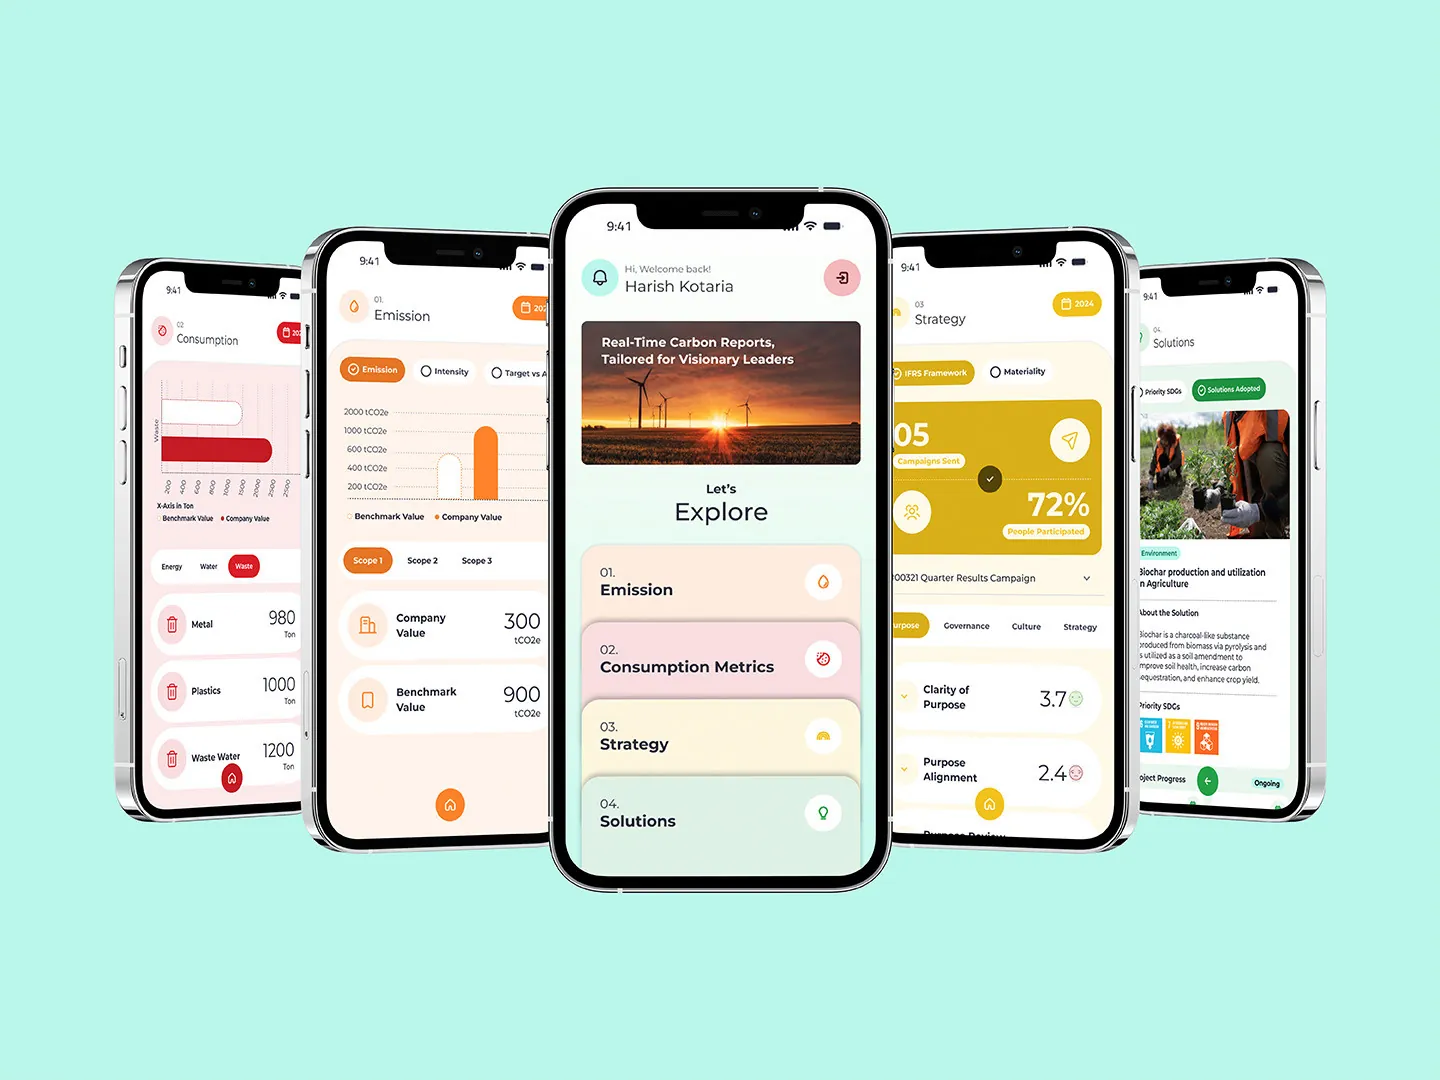
“Explore” lists the four modules as big numbered cards, one tap from the detail.
Explore home screen with four modules

Decision 02

Every module has its own colour

Why
When you only glance, colour tells you where you are faster than a title.
What I did
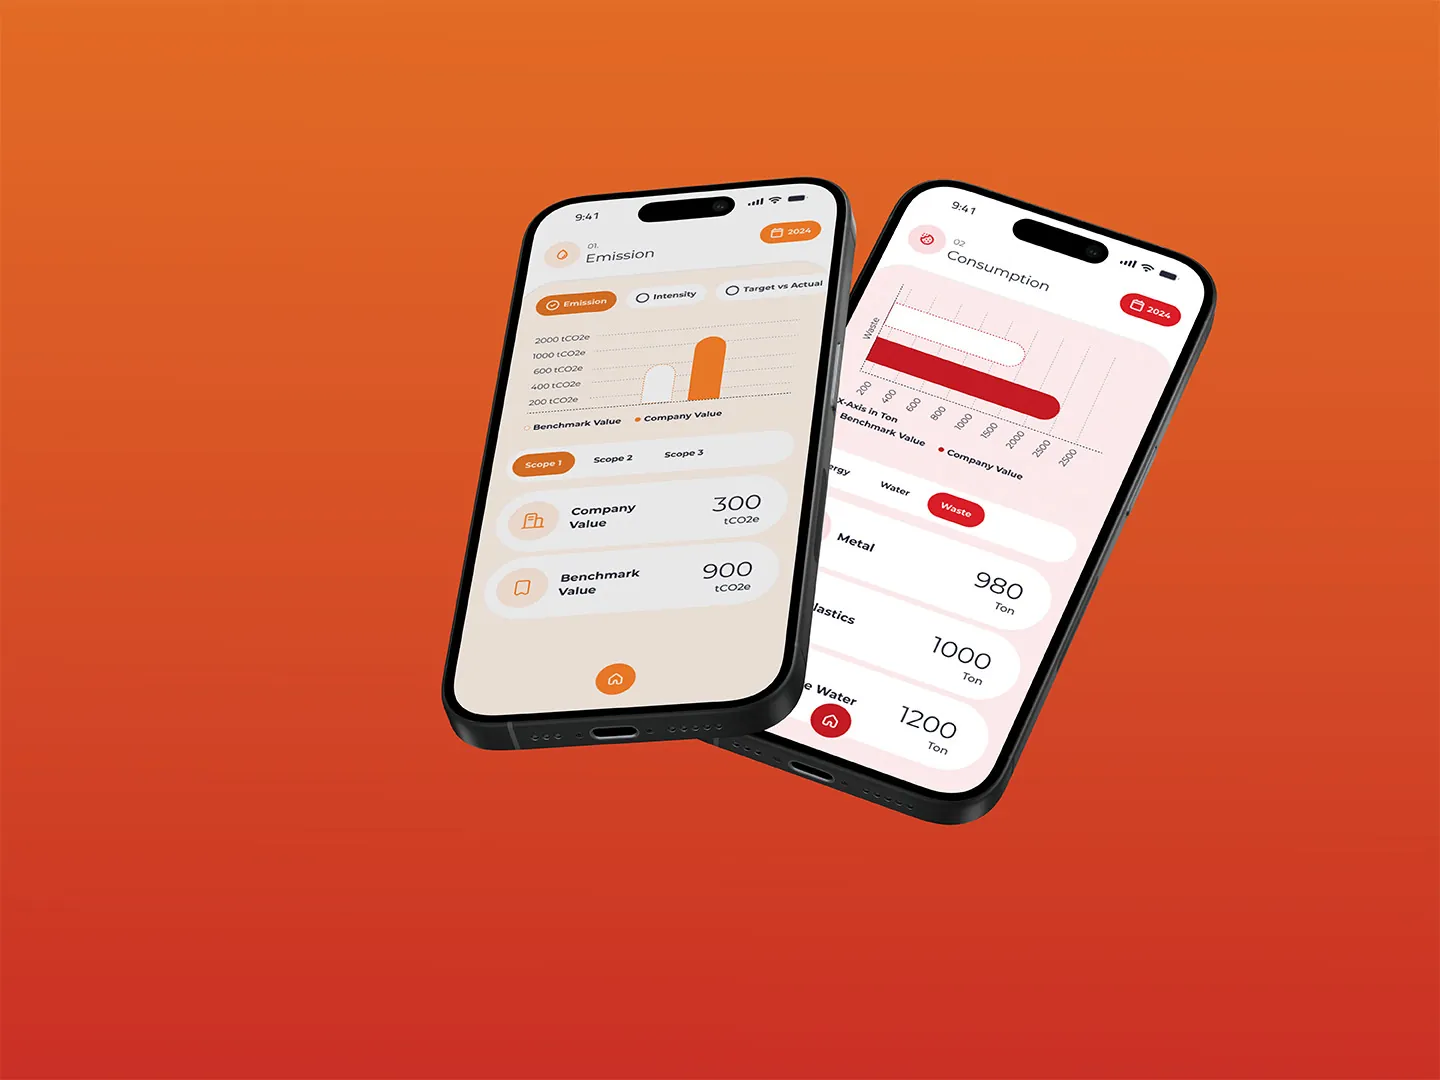
Emission is orange, consumption red, strategy yellow, solutions green, used the same way on every screen.
Emission and consumption screens

Decision 03

Trends and targets, not tables

Why
A leader wants to know “are we on track?”, not read every row.
What I did
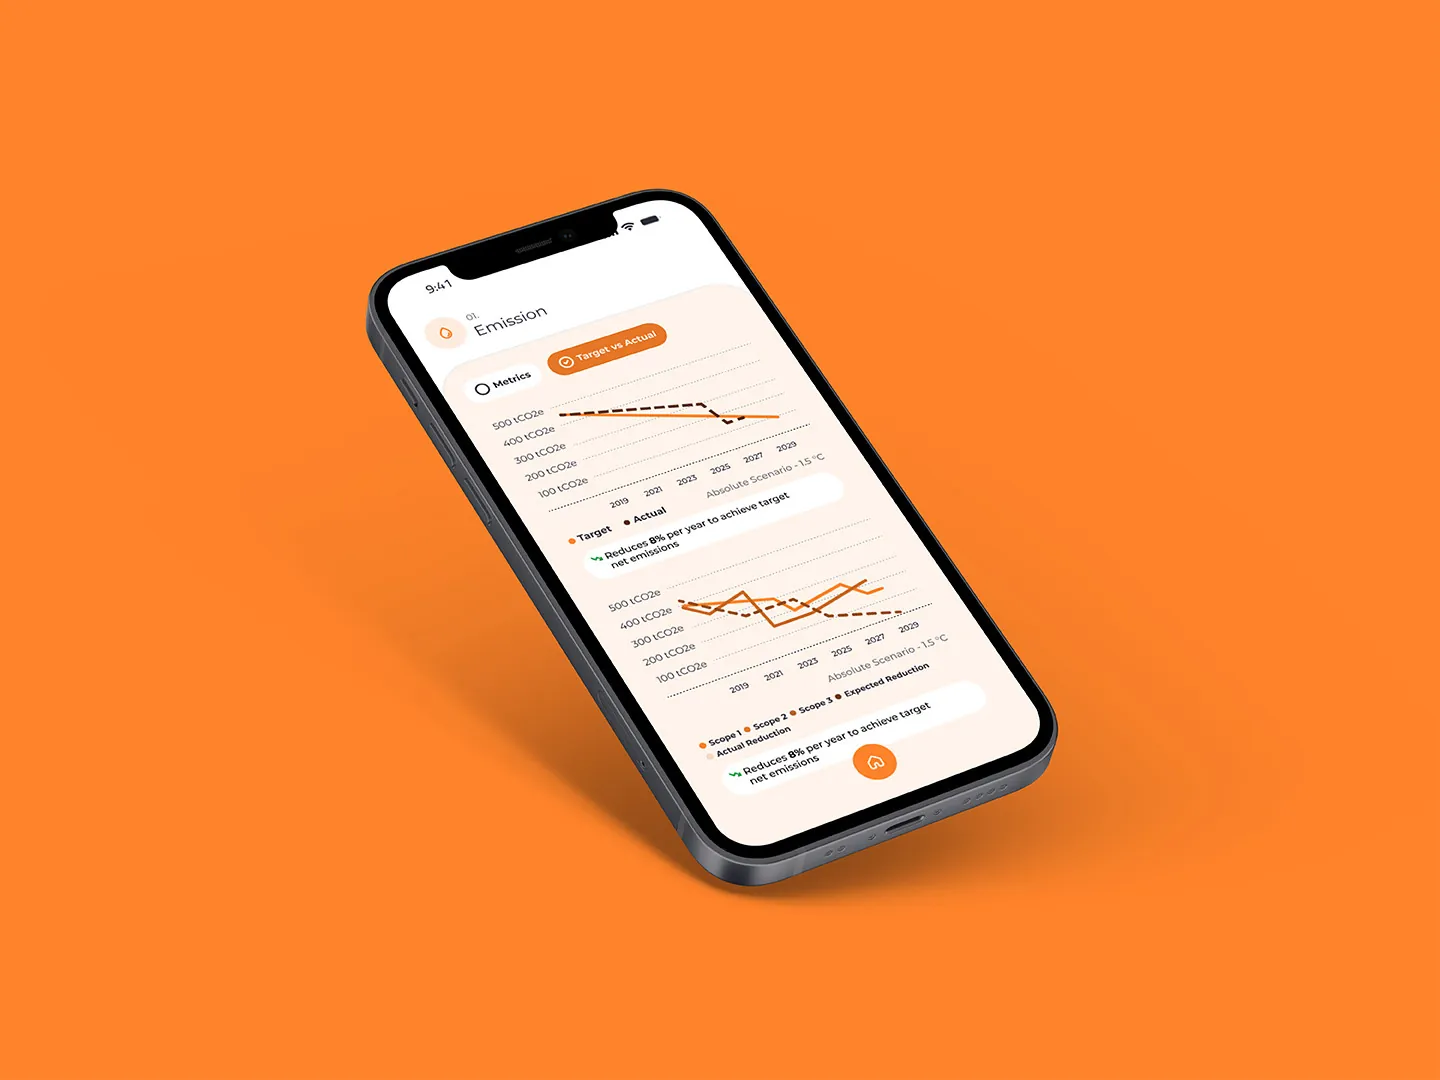
Charts compare actuals with targets and benchmarks, with the key number shown large.
Emission trend chart against target

05 · The screens

Seven flows, one calm app

  • Onboarding
  • Tour guide
  • Notifications
  • Emission
  • Consumption
  • Strategy
  • Solutions
Splash screen
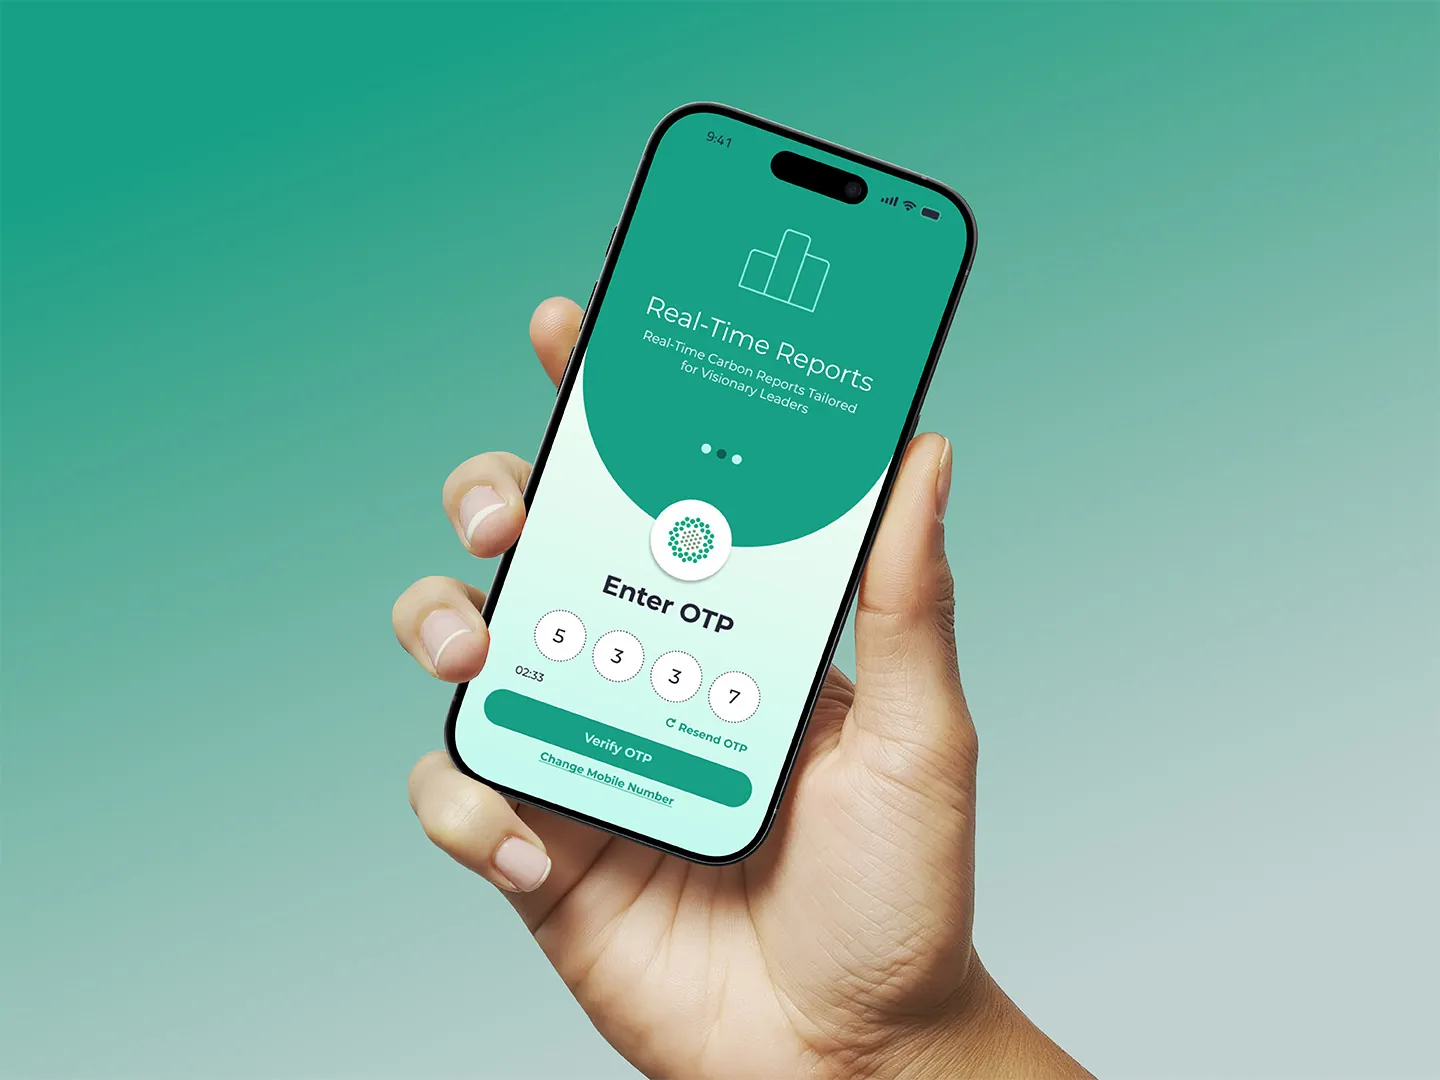
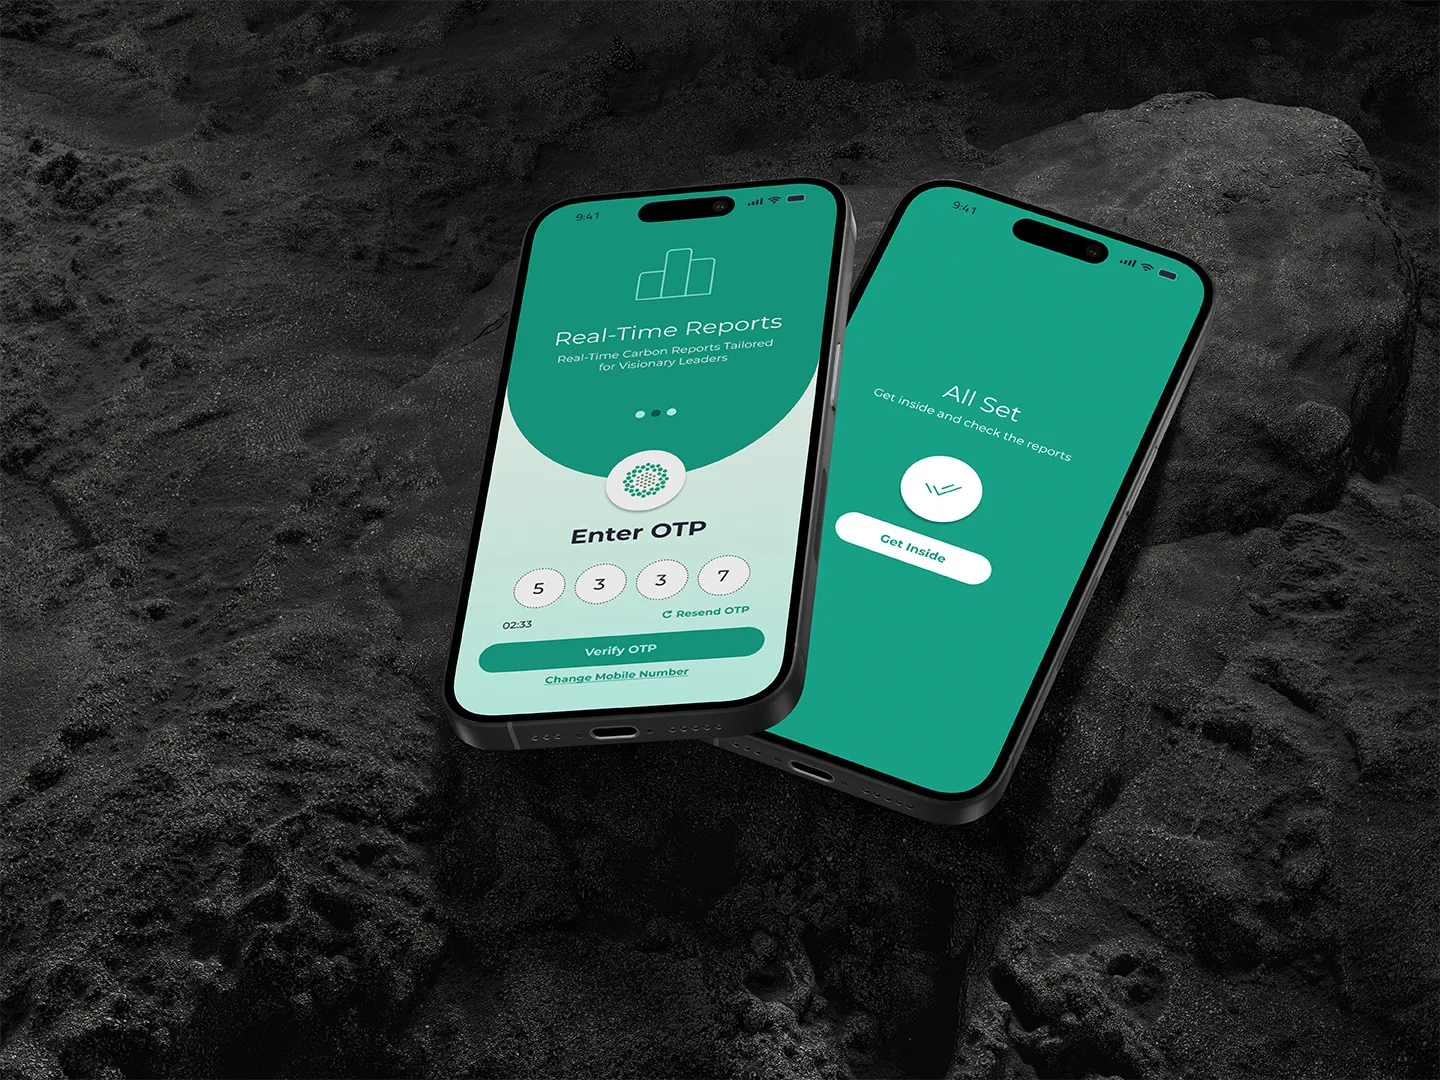
OTP sign-in
Explore home
Emission and consumption
Emission trend
Sign-in complete
All main screens

Got data that people don't read?

  • I turn dense dashboards and reports into screens busy people actually use.
  • Fast when it matters: this one went from kickoff to prototype in 3 weeks.
  • Comfortable interviewing senior leaders and turning what they say into design.

Next case study

Metaphor Interiors →

A digital home for earth‑friendly interior solutions.
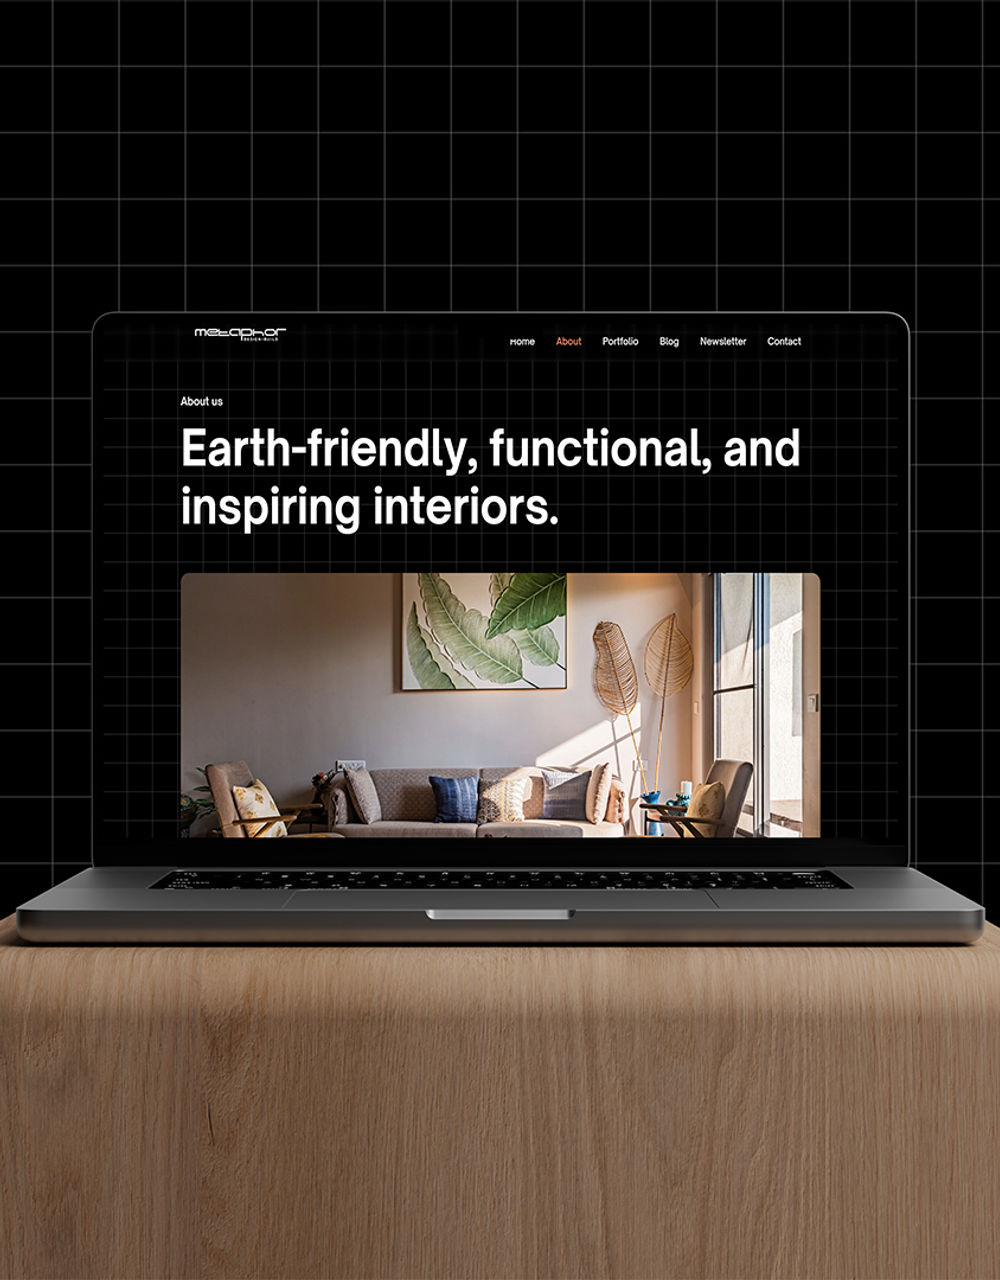
Metaphor Interiors website